May 2022 / INVESTMENT INSIGHTS
Global Asset Allocation Viewpoints
Our experts share perspective on market themes and regional trends, plus insights into current portfolio positioning.
Market Perspective
As of 30 April 2022
- Global growth are estimates trending lower on heightened geopolitical risk and COVID lockdowns in China are weighing on supply chains and potentially exacerbating already elevated inflation.
- Despite moderating growth expectations, developed market central banks are expected to advance tightening policies to combat decades-high inflation, with the US Federal Reserve leading with the most aggressive plans. The European Central Bank (ECB) accelerates ending asset purchases and considers future rate hikes, while the Bank of Japan remains steadfast on its policy of yield curve control.
- Emerging market central banks remain biased towards tightening to fend off inflation and defend currencies, while China policies continue moving in the opposite direction to stimulate growth to help catch up to growth targets following COVID-related lockdowns.
- Key risks to global markets include central bank missteps, commodity impact of Russia-Ukraine conflict, lingering inflation, and China balancing growth amid COVID-related lockdowns.
Portfolio Positioning
As of 30 April 2022
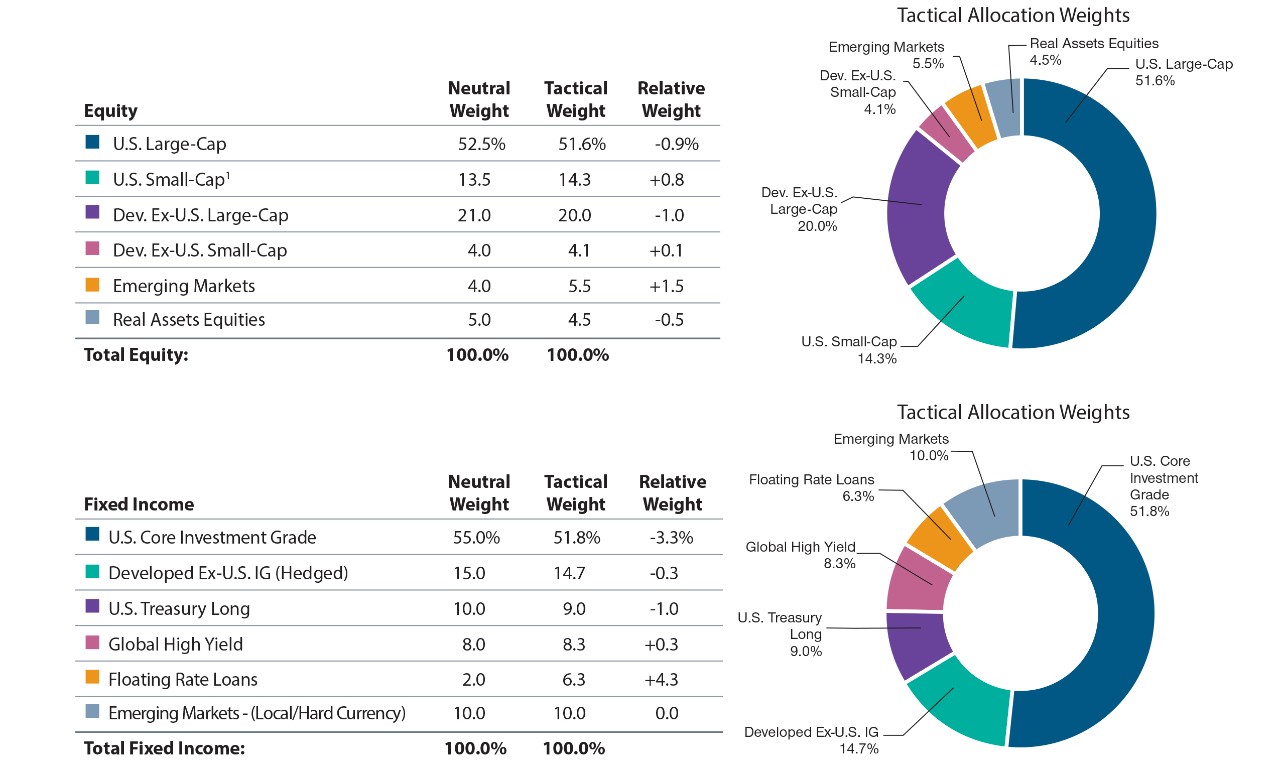
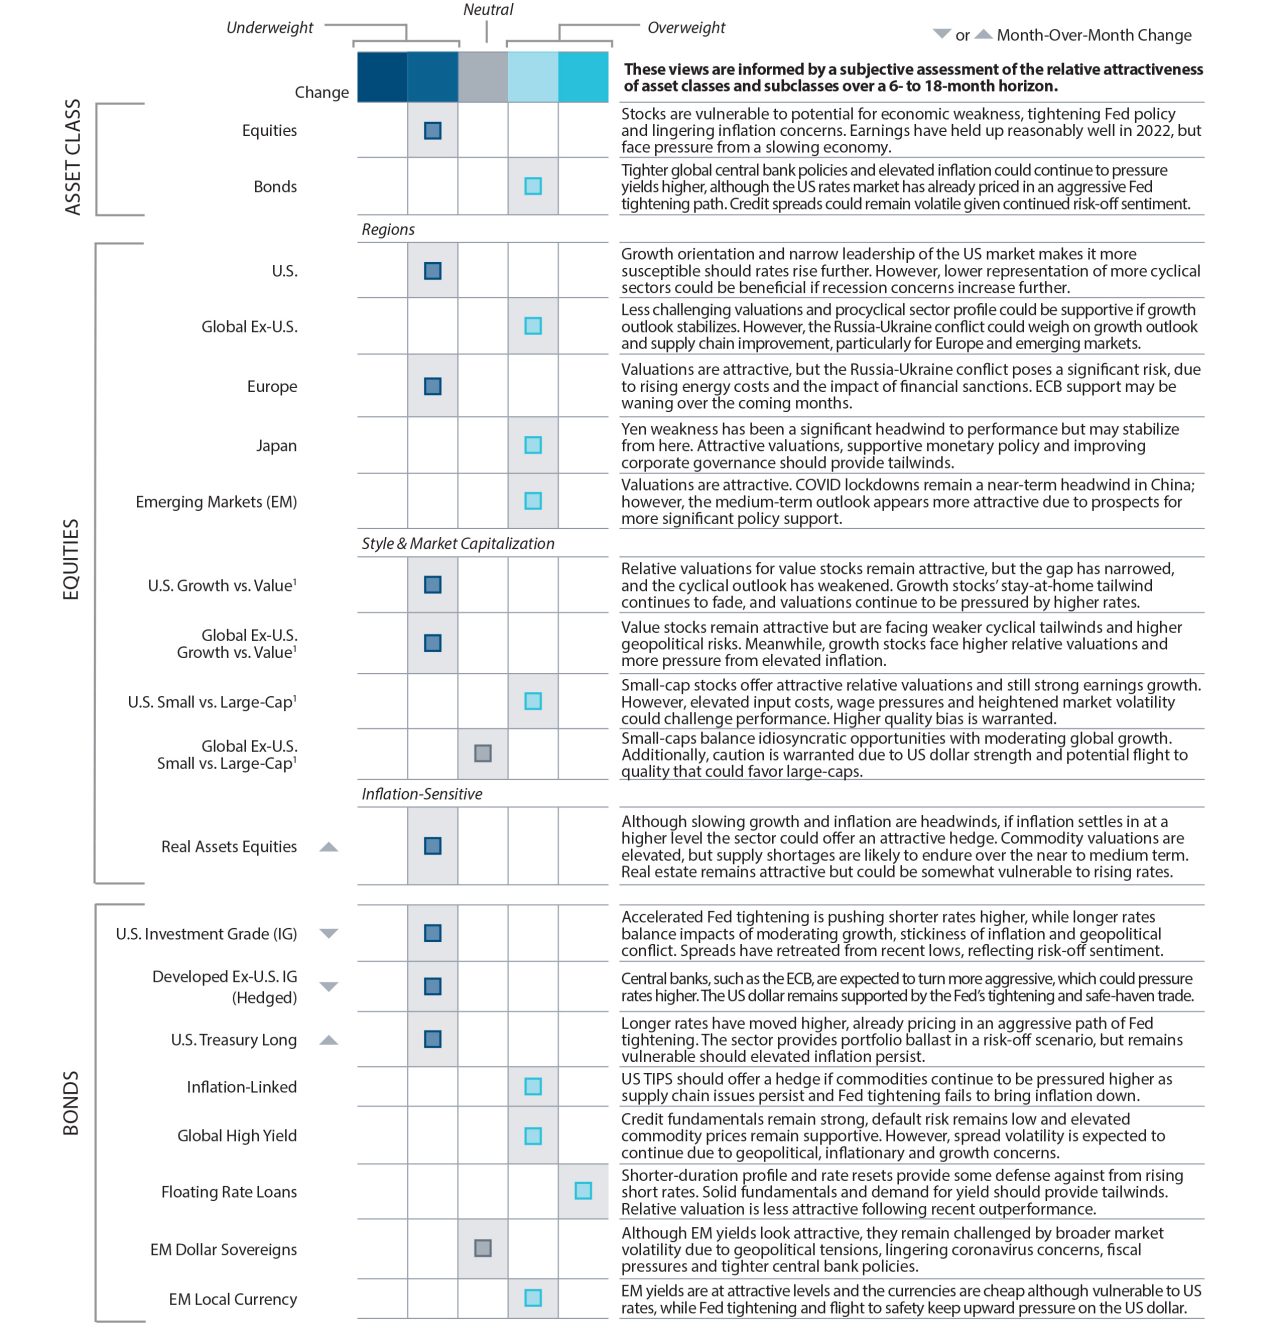
- Despite lower valuations amid recent declines, we remain underweight equities given a moderating growth and earnings outlook amid a hawkish Fed battling high inflation. Within fixed income, we remain underweight bonds and overweight cash.
- Within equities, we continued to add to real assets-related equities to provide a hedge should inflationary pressures persist longer than expected.
- Within fixed income, we continue to favor shorter-duration and higher-yielding sectors through overweights to short-term TIPS, floating rate loans and high yield bonds supported by still solid fundamentals while keeping a cautious eye on liquidity and volatility.
- To provide some defense against growing market risks, we further moderated our underweight to long-term US Treasuries following recent moves higher in rates.
Market Themes
As of 30 April 2022
Where to Hide?
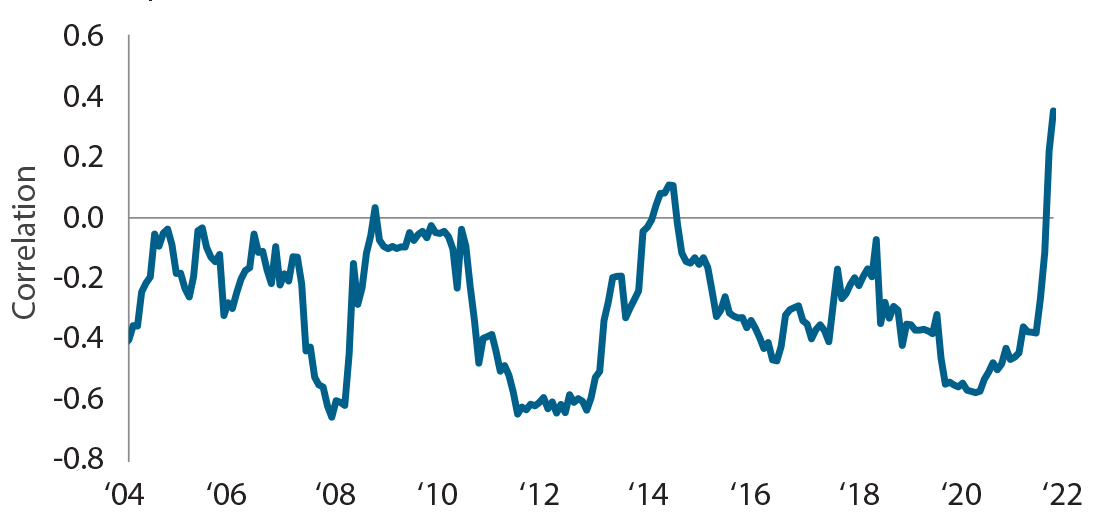
War, inflation, and lingering COVID impacts have set the stage for a challenging start to 2022 for investors, with both stocks and bonds down over 9% in response. While dynamic, stocks and bonds on average have a low correlation with each other and their correlation can move sharply negative during risk-off periods. However, this time is quite unique with runaway inflation sparking aggressive central bank tightening all while growth is moderating amid a world full of rising risks. These concerns of rising rates and inflation are contributing to a retreat in bonds. At the same time, rising rates and slowing growth are weighing on equity markets in a period where valuations are already above average. This unfortunate rise in stock-to-bond correlation is weighing on even the most conservative of investors. While it’s hard to gauge the path forward given the unprecedented confluence of issues facing global markets, a cautious approach is warranted, especially to mitigate more extreme tail events, including more persistent inflation or a hard landing in the economy.
Stock & Bond Correlations on the Rise1
As of 30 April 2022

Past performance is not a reliable indicator of future performance.
Sources: Bloomberg Finance L.P. and S&P. Please see the last page for more information about this S&P information.
1 Chart represents rolling 2-year correlation of monthly price changes of the S&P 500 Index and U.S. 10-Year Treasury Futures.
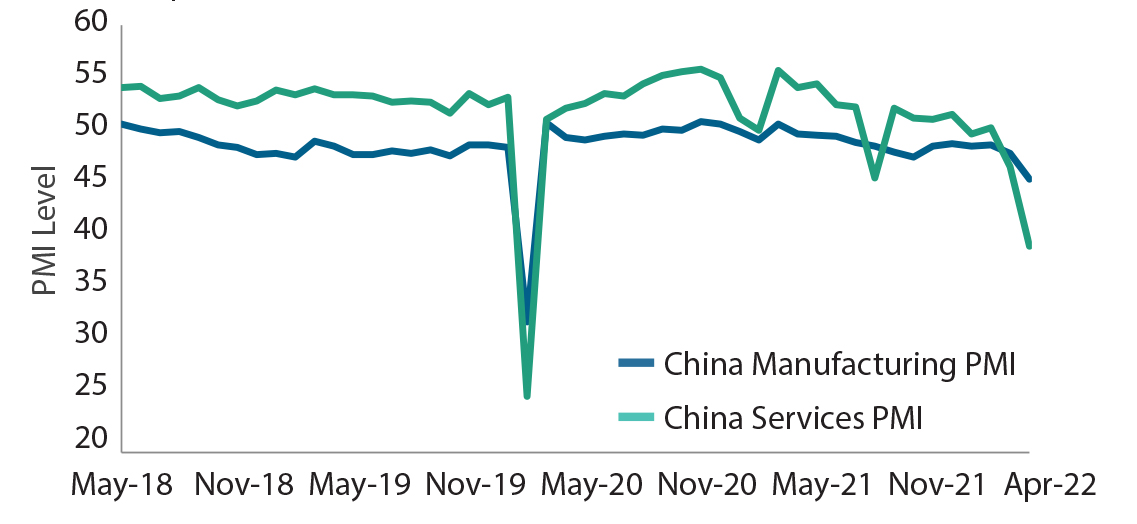
2 Chart shows China Manufacturing PMI Index and China Non-Manufacturing PMI Index (representing Services PMI).
FOR INVESTMENT PROFESSIONALS ONLY. NOT FOR FURTHER DISTRIBUTION.
Walking a Tightrope
As the rest of the world is seeing fewer outbreaks and learning to cope with COVID, China, on the other hand, has faced a new wave of outbreaks forcing it to enact “zero-COVID” lockdown policies, which are taking a toll on the nation’s growth and potentially spilling over to the rest of the world. The stringent lockdowns in Shanghai, an export hub, and most recently in Beijing are weighing on the ability to transport goods, further impacting already fractured global supply chains. The market increasingly expects China to further ease monetary and fiscal policy in response to the recent weakness. However, as they do, they will not want to reflate speculative bubbles that they burst last year, most notably the housing sector. With the presidential election approaching, and President Xi Jinping up for an unprecedented third term, he seems determined to reach China’s lofty 5.5% gross domestic product target that is severely challenged by COVID lockdowns. This leaves policymakers walking a tightrope should they seek to maintain the aggressive lockdowns and reach growth targets, while providing just enough stimulus not to overheat some sectors of the market.
China’s Manufacturing & Services Data Taking a Hit2
As of 30 April 2022

Past performance is not a reliable indicator of future performance.
Sources: Bloomberg Finance L.P. and S&P. Please see the last page for more information about this S&P information.
1 Chart represents rolling 2-year correlation of monthly price changes of the S&P 500 Index and U.S. 10-Year Treasury Futures.
2 Chart shows China Manufacturing PMI Index and China Non-Manufacturing PMI Index (representing Services PMI).
FOR INVESTMENT PROFESSIONALS ONLY. NOT FOR FURTHER DISTRIBUTION.
Regional Backdrop
As of 30 April 2022
| Positives | Negatives | |
|---|---|---|
| United States |
|
|
| Europe |
|
|
| Developed Asia/Pacific |
|
|
| Emerging Markets |
|
|
Asset Allocation Committee Positioning
As of 30 April 2022
Portfolio Implementation
As of 30 April 2022

1 U.S. small-cap includes both small- and mid-cap allocations.
Source: T. Rowe Price. Unless otherwise stated, all market data are sourced from FactSet. Copyright 2022 FactSet. All Rights Reserved.
These are subject to change without further notice. Figures may not total due to rounding.
Neutral equity portfolio weights representative of a U.S.-biased portfolio with a 70% U.S. and 30% international allocation; includes allocation to real assets equities. Core fixed income allocation representative of U.S.-biased portfolio with 55% allocation to U.S. investment grade.
Source: MSCI. MSCI and its affiliates and third party sources and providers (collectively, “MSCI”) makes no express or implied warranties or representations and shall have no liability whatsoever with respect to any MSCI data contained herein. The MSCI data may not be further redistributed or used as a basis for other indices or any securities or financial products. This report is not approved, reviewed, or produced by MSCI. Historical MSCI data and analysis should not be taken as an indication or guarantee of any future performance analysis, forecast or prediction. None of the MSCI data is intended to constitute investment advice or a recommendation to make (or refrain from making) any kind of investment decision and may not be relied on as such.
“Bloomberg®” and Bloomberg Indices are service marks of Bloomberg Finance L.P. and its affiliates, including Bloomberg Index Services Limited (“BISL”), the administrator of the index (collectively, “Bloomberg”) and have been licensed for use for certain purposes by T. Rowe Price. Bloomberg is not affiliated with T. Rowe Price, and Bloomberg does not approve, endorse, review, or recommend Global Asset Allocation Viewpoints. Bloomberg does not guarantee the timeliness, accurateness, or completeness of any data or information relating to Global Asset Allocation Viewpoints.
The S&P Index is a product of S&P Dow Jones Indices LLC, a division of S&P Global, or its affiliates (“SPDJI”) and has been licensed for use by T. Rowe Price. Standard & Poor’s® and S&P® are registered trademarks of Standard & Poor’s Financial Services LLC, a division of S&P Global (“S&P”); Dow Jones® is a registered trademark of Dow Jones Trademark Holdings LLC (“Dow Jones”). This product is not sponsored, endorsed, sold or promoted by SPDJI, Dow Jones, S&P, their respective affiliates, and none of such parties make any representation regarding the advisability of investing in such product(s) nor do they have any liability for any errors, omissions, or interruptions of the S&P Index.
Important Information
This material is being furnished for general informational and/or marketing purposes only. The material does not constitute or undertake to give advice of any nature, including fiduciary investment advice. Prospective investors are recommended to seek independent legal, financial and tax advice before making any investment decision. T. Rowe Price group of companies including T. Rowe Price Associates, Inc. and/or its affiliates receive revenue from T. Rowe Price investment products and services. Past performance is no guarantee or a reliable indicator of future results.. The value of an investment and any income from it can go down as well as up. Investors may get back less than the amount invested.
The material does not constitute a distribution, an offer, an invitation, a personal or general recommendation or solicitation to sell or buy any securities in any jurisdiction or to conduct any particular investment activity. The material has not been reviewed by any regulatory authority in any jurisdiction.
Information and opinions presented have been obtained or derived from sources believed to be reliable and current; however, we cannot guarantee the sources’ accuracy or completeness. There is no guarantee that any forecasts made will come to pass. The views contained herein are as of the date written and are subject to change without notice; these views may differ from those of other T. Rowe Price group companies and/or associates. Under no circumstances should the material, in whole or in part, be copied or redistributed without consent from T. Rowe Price.
The material is not intended for use by persons in jurisdictions which prohibit or restrict the distribution of the material and in certain countries the material is provided upon specific request. It is not intended for distribution to retail investors in any jurisdiction.
USA—Issued in the USA by T. Rowe Price Associates, Inc., 100 East Pratt Street, Baltimore, MD, 21202, which is regulated by the U.S. Securities and Exchange Commission. For Institutional Investors only.
© 2024 T. Rowe Price. All Rights Reserved. T. ROWE PRICE, INVEST WITH CONFIDENCE, and the Bighorn Sheep design are, collectively and/or apart, trademarks of T. Rowe Price Group, Inc.
May 2022 / SEARCH FOR YIELD
