
January 2022 / INVESTMENT INSIGHTS
Pension Curve Insider: LDI Solutions January Monthly Recap
Monthly Recap
Treasury yields moved higher during the month of December, as markets shrugged off concerns for the Omicron variant and the Federal Reserve announced an accelerated timetable for asset purchase tapering. Despite elevated volatility in other parts of financial markets, corporate spreads remained stable through the month.
Plan liability values decreased slightly on a marked-to-market basis, reversing November’s increase. Discount rates for a sample plan liability rose by 8 basis points based on the AA-rated spot curve and 11 basis points using the top-yielding curve. At month end, the top-yielding curve provided 39 basis points of additional yield versus the broader AA-rated universe.
December was quiet from an issuance perspective, with only $2.0B in new bonds entering the index during the month. New issues had a negligible upward impact on the intermediate to long end of the curve. No turnover occurred due to credit rating changes, though a handful of bonds exited due to other index inclusion criteria.
Liability impact
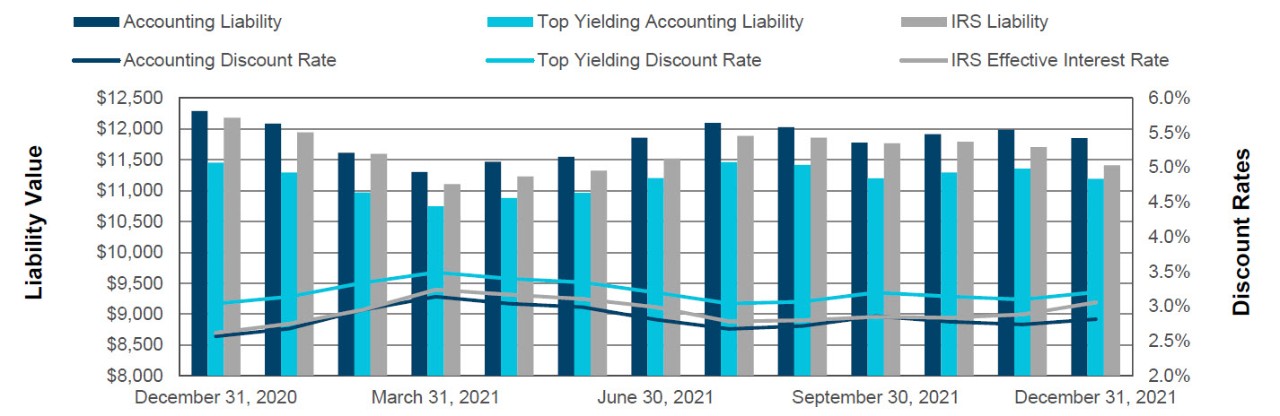
| Yield Curve | Liability Value 12/31/21 |
Discount Rate 12/31/21 |
Liability Value 11/31/21 |
Discount Rate 11/31/21 |
Liability Value 12/31/20 |
Discount Rate 12/31/20 |
|---|---|---|---|---|---|---|
| Accounting Yield Curve |
$11,849 | 2.82% | $11,986 | 2.74% | $12,288 | 2.57% |
| Top Yielding Accounting Curve |
$11,192 | 3.21% | $11,357 | 3.10% | $11,456 | 3.04% |
| IRS Yield Curve | $11,411 | 3.06% | $11,794 | 2.83% | $12,182 | 2.62% |
Sources: Bloomberg Barclays. Bloomberg Index Services Ltd. Copyright 2021, Bloomberg Index Services Ltd. Used with permission. IRS, and T. Rowe Price. Sample plan cash flows have a liability of $10,000 at 4.0% discount rate.
Accounting Curve
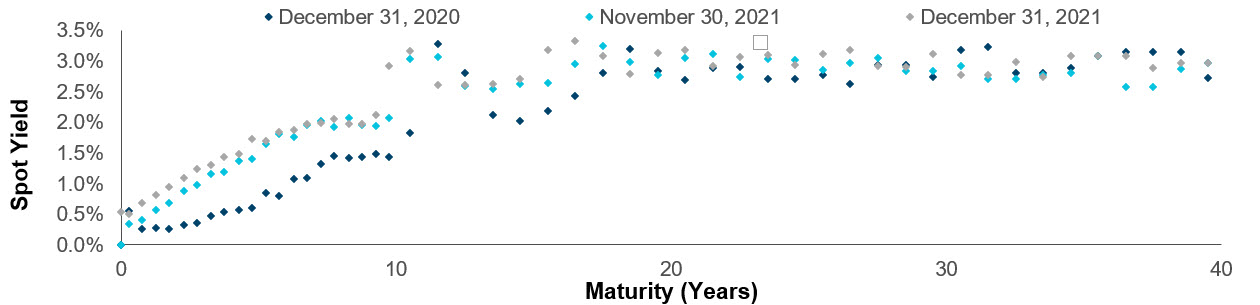
Sources: Bloomberg. Bloomberg Index Services Ltd. Copyright 2021, Bloomberg Index Services Ltd. Used with permission. T. Rowe Price.
| Issuer | Event | Curve Impact |
|---|---|---|
| BlackRock, Inc. | New Issue (1 Bond) |
BlackRock, the New York based asset management firm, issued a senior unsecured bond dated to mature in 2032. The $1.0B offering was the largest issue during the month, and traded slightly wide of similarly-dated issues at month end. |
Sales Tax Securitization Corporation (City of Chicago) |
New Issues (1 Bond) |
The City of Chicago sold another issue in a series of Sales Tax Securitization Bonds during December, dated to mature in 2042. Issued through the Sales Tax Securitization Corporation special purpose entity, the bond is supported by a portion of the city’s sales tax revenues. The bond traded wide of its maturity segment in the index. |
| Multiple | Exits (5 Bonds) |
Five bonds exited the universe during the month, due to redemption activity or call provisions. Four of the bonds, totalling $3.5B at the start of the month, were subject to repurchases by their issuers which brought outstanding amounts below the index inclusion minimum. One bond, worth $1.3B at month end, fell out of the index due to a call provision with an exercise date option within five years. |
Sources: Bloomberg Barclays. Bloomberg Index Services Ltd. Copyright 2021, Bloomberg Index Services Ltd. Used with permission. T. Rowe Price.
| New Issues | Other Bonds Entering | Downgrades | Other Bonds Exiting | |
|---|---|---|---|---|
| December 2021 | ||||
| Count | 4 | -- | -- | 5 |
| Market Value ($M) | $2,060 | -- | -- | $3,479 |
| Market Value (%) | 0.3% | -- | -- | 0.51% |
| 2021 YTD | ||||
| Count | 112 | 41 | 36 | 24 |
| Market Value ($M) | $98,711 | $66,452 | $33,905 | $26,457 |
| Market Value (%) | 14.41% | 13.9% | 4.88% | 3.86% |
Sources: Bloomberg Barclays. Bloomberg Index Services Ltd. Copyright 2021, Bloomberg Index Services Ltd. Used with permission. T. Rowe Price.
Top Yielding Accounting Curve
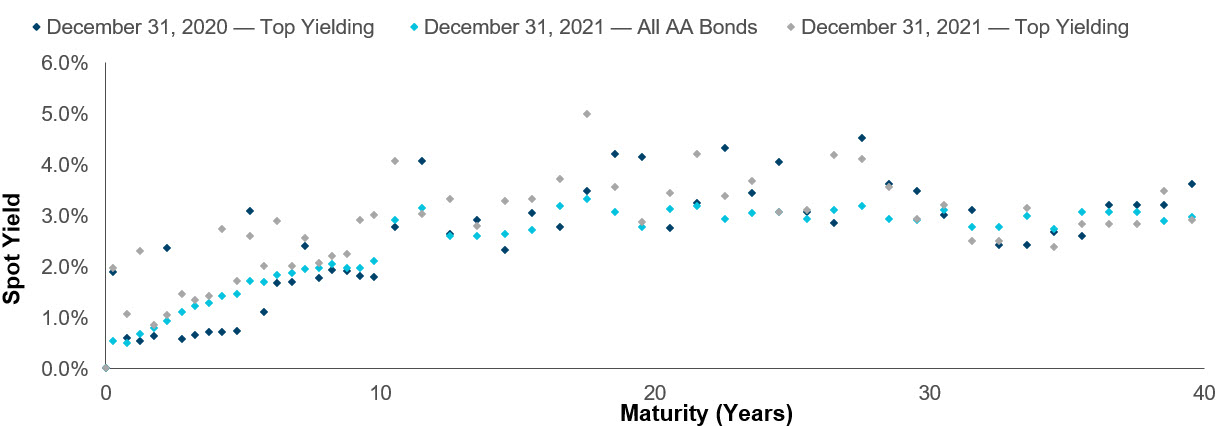
Sources: Bloomberg. Bloomberg Index Services Ltd. Copyright 2021, Bloomberg Index Services Ltd. Used with permission. T. Rowe Price.
IRS Curve
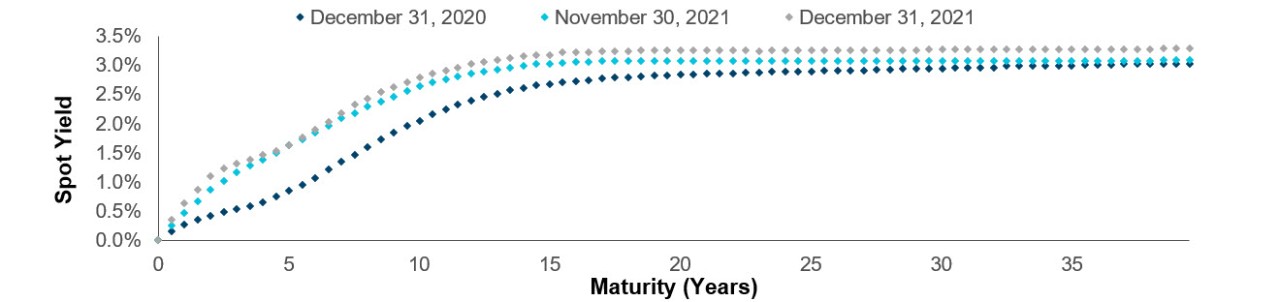
Sources: IRS and T. Rowe Price
| Dates | AAA Corporate OAS (basis points) |
AA Corporate OAS | A Corporate OAS | BBB Corporate OAS |
|---|---|---|---|---|
| November Monthly Average | 64 | 49 | 71 | 109 |
| December 1, 2021 | 78 | 55 | 80 | 121 |
| December 15, 2021 | 72 | 53 | 77 | 118 |
| December 31, 2021 | 65 | 49 | 73 | 112 |
| December Monthly Average | 70 | 52 | 76 | 116 |
Sources: Bloomberg Barclays. Bloomberg Index Services Ltd. Copyright 2021, Bloomberg Index Services Ltd. Used with permission. T. Rowe Price.
One Year Rolling Returns and Tracking Error
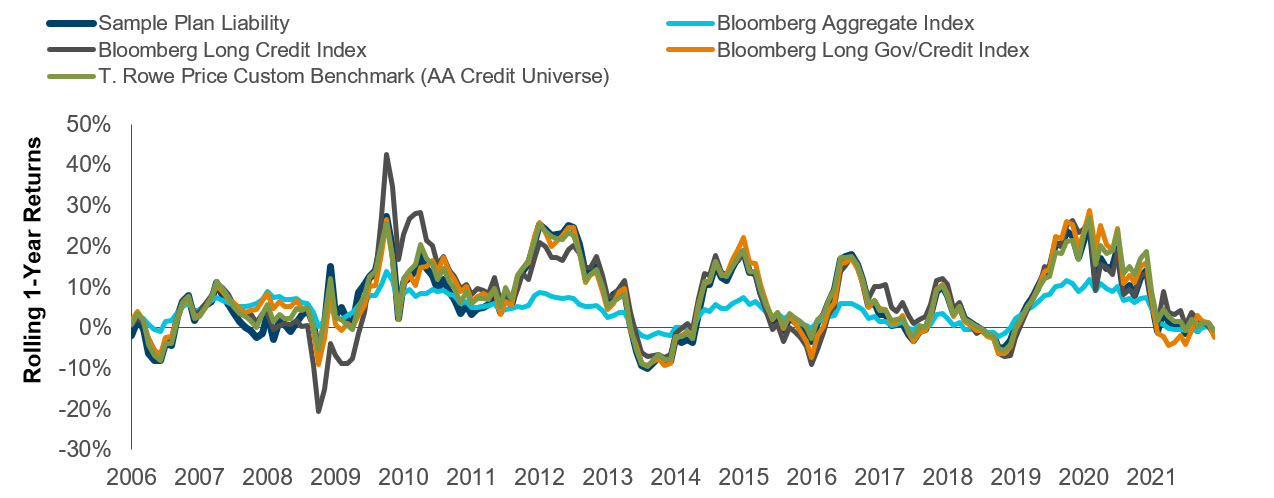
| December 2021 Return | YTD Total Return | Annual Tracking Error Relative to Liability | Average Monthly Return Difference from Liability | |
|---|---|---|---|---|
| Hypothetical Sample Plan Liability | -0.95% | -1.34% | NA | NA |
| BBgBarc Aggregate Index | -0.37% | -1.55% | 6.58% | 1.43% |
| BBgBarc Long Credit Index | -0.37% | -1.18% | 4.36% | 0.89% |
| BBgBarc Long Gov/Credit Index | -0.82% | -2.51% | 3.17% | 0.64% |
| Hypothetical T. Rowe Price Custom Benchmark |
-0.99% | -0.73% | 2.01% | 0.32% |
Sources: Bloomberg Index Services Ltd., T. Rowe Price; Analysis by T. Rowe Price. Performance shown in graph and tables above shown from February 1, 2005 through December 31, 2021.
Past performance cannot guarantee future results. Custom Benchmark returns do not reflect the deduction of management fees. Please refer to the disclosure at the end of the article for important additional information.
Copyright 2021, Bloomberg Index Services Ltd. Used with permission.
Glossary
IRS Yield Curve: Plan sponsors of qualified defined benefit pension plans use this yield curve to determine funding requirements per IRS regulations. These funding requirements are disclosed on form 5500 annually. Yields on AAA, AA, and A corporate securities determine the yield curve for discounting purposes. The yield curve is not a marked-to-market curve representing any single date, but rather an average yield over the course of the entire month. For more information on the IRS methodology, please see treasury.gov/resource-center and irs.gov/Retirement-Plans.
Accounting Yield Curve: US GAAP requires pension plan sponsors to disclose pension obligations using “fixedincome debt securities that receive one of the two highest ratings given by a recognized ratings agency”. As a proxy for bonds useable for accounting purposes, we use the constituents of BBgBarc AA credit universe to develop the accounting yield curve shown. Please see fasb.org for more information.
Top Yielding Curve: Since the US GAAP rules allow the use of a fairly broad range of securities for accounting purposes, some plan sponsors use an optimized yield curve approach to value their pension liabilities on the disclosure dates. Bonds trading at higher yields than other bonds of similar maturity tend to be used for this purpose. To quantify the effectiveness of this approach, T. Rowe Price developed a yield curve using the highest yielding bonds designed to meet SEC requirements at each node.
Annual Tracking Error Relative to Liability: Calculated as the standard deviation of return differences between a fixed income index and a set of cash flows discounted using the accounting yield curve. The liability return has two components: an interest cost component analogous to roll return on a bond, and yield change component analogous to price return on a bond. The table shows annualized ex-post tracking error.
Average Monthly Return Difference: Similar to the tracking error metric, this metric demonstrates how closely a fixed income benchmark tracks a set of liability returns. We calculate this measure by simply averaging the difference in returns over the period shown.
Sample Plan Liability: Pension plan sponsors must account for the cost of their retirement plan on their financial statements. The amount of this liability can fluctuate over time based on several factors, including benefits earned, benefits paid out, mortality experience, and most significantly, interest rates. The Sample Plan is intended to be a representative defined benefit pension plan and does not reflect the cash flows from any specific plan.
T. Rowe Price Custom Benchmark: An index of fixed income securities created using T. Rowe Price proprietary methodology that attempts to replicate interest rate exposures embedded in a pension plan’s liability structure.
To learn more, please visit troweprice.com
Important Information
This material is being furnished for general informational and/or marketing purposes only. The material does not constitute or undertake to give advice of any nature, including fiduciary investment advice. Prospective investors are recommended to seek independent legal, financial and tax advice before making any investment decision. T. Rowe Price group of companies including T. Rowe Price Associates, Inc. and/or its affiliates receive revenue from T. Rowe Price investment products and services. Past performance is no guarantee or a reliable indicator of future results.. The value of an investment and any income from it can go down as well as up. Investors may get back less than the amount invested.
The material does not constitute a distribution, an offer, an invitation, a personal or general recommendation or solicitation to sell or buy any securities in any jurisdiction or to conduct any particular investment activity. The material has not been reviewed by any regulatory authority in any jurisdiction.
Information and opinions presented have been obtained or derived from sources believed to be reliable and current; however, we cannot guarantee the sources’ accuracy or completeness. There is no guarantee that any forecasts made will come to pass. The views contained herein are as of the date written and are subject to change without notice; these views may differ from those of other T. Rowe Price group companies and/or associates. Under no circumstances should the material, in whole or in part, be copied or redistributed without consent from T. Rowe Price.
The material is not intended for use by persons in jurisdictions which prohibit or restrict the distribution of the material and in certain countries the material is provided upon specific request. It is not intended for distribution to retail investors in any jurisdiction.
USA—Issued in the USA by T. Rowe Price Associates, Inc., 100 East Pratt Street, Baltimore, MD, 21202, which is regulated by the U.S. Securities and Exchange Commission. For Institutional Investors only.
© 2024 T. Rowe Price. All Rights Reserved. T. ROWE PRICE, INVEST WITH CONFIDENCE, and the Bighorn Sheep design are, collectively and/or apart, trademarks of T. Rowe Price Group, Inc.