September 2021 / U.S. FIXED INCOME
Navigating Dynamic Fixed Income Market Crosscurrents
Flexible duration positioning and sector allocation are key.
Key Insights
- Flexibility and a collaborative multi-sector approach, in our view, are particularly important in navigating today’s dynamic market environment.
- We seek to combine well-diversified sector allocation with tactical insights to pursue consistent risk-adjusted returns across different market environments.
- Seeking to capitalize on bond market inefficiencies while constructing a diversified, risk-balanced portfolio informs our strategic asset allocation and positioning.
Flexibility and a collaborative multi‑sector approach, in our view, are essential components of fixed income portfolio management. These are particularly important in navigating the crosscurrents of today’s dynamic market environment. After rapidly increasing earlier in 2021 amid inflation fears, longer‑term U.S. Treasury yields have recently decreased as the delta variant of the coronavirus threatens to weigh on the global economic rebound. Interest rates are still quite low by historical standards. In most credit sectors, credit spreads1 steadily tightened through the first half of the year before modestly widening as growth appeared to peak as we entered the third quarter.
Markets are still examining the implications of the Federal Reserve’s new monetary policy framework, which aims to maximize employment by allowing for periods of above‑target inflation without the central bank raising rates, as it prepares to taper its bond purchases. Our flexible, active portfolio management approach should give us opportunities to take advantage of anomalies that are present in this unusual environment—as well as inefficiencies that tend to persist regardless of the macro backdrop—while managing risk in the US Total Return Bond Strategy.
Shifts in Fed Messaging
Fed policymakers have realized that inflation is much more difficult to generate than to suppress with monetary policy and that moderate inflation of around 2% is conducive to economic growth. Under the new monetary policy framework, they vowed to wait until they see actual inflation at a healthy level before even thinking about raising rates to cool off the economy, no matter how low the unemployment rate is. This was a historic change, and it led to a rapid increase in longer‑term yields in the first quarter as markets anticipated that the Fed would let the economy expand rapidly without worrying about inflation.
However, the tone of the Fed’s messaging seemed to shift leading up to its June policy meeting and in its subsequent communications, likely in response to the meaningfully elevated inflation readings experienced as the economy opened in earnest in the second quarter of 2021 and unleashed a wave of pent‑up demand. Fed policymakers indicated that discussions about tapering asset purchases had commenced and that rate hikes could begin in 2023. While the Fed remains far from hawkish, policymakers appeared to have become concerned about falling behind the inflation curve and being forced to aggressively tighten policy.
Markets interpreted the change as an indication that both tapering and rate increases would start sooner than originally anticipated, but that the eventual rate hikes would not be as abrupt and the federal funds rate would peak at a lower level. As a result, the Treasury yield curve flattened as longer‑term yields decreased—an indicator of falling long‑term growth expectations—and short‑term yields increased, showing expectations for earlier rate hikes. This was a reversal of the trend in the first quarter of the year, when the yield curve steepened as markets anticipated that the Fed would allow the economy to run hot.
Treasuries Have Been Strong Diversifiers
(Fig. 1) Correlation of 10-year Treasury and credit indexes*
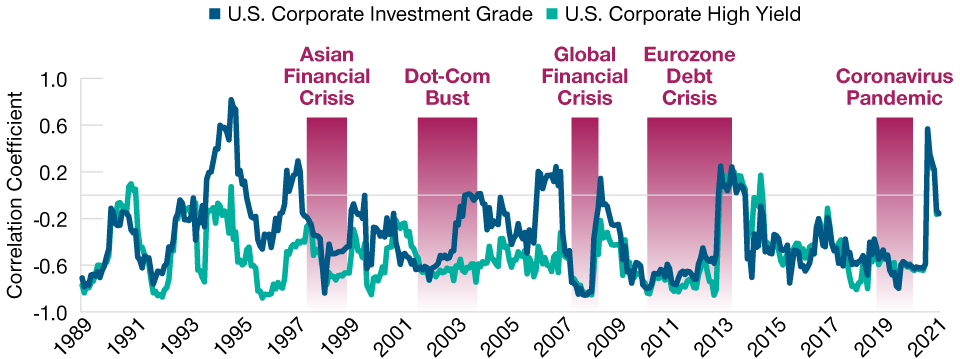
As of August 31, 2021.
Past performance is not a reliable indicator of future performance.
Source: Barclays Live/Haver Analytics.*
Rolling 12-month correlation of credit index excess returns. Correlation measures how one assetclass, style, or individual group may be related to another. A perfect positive correlation means that thecorrelation coefficient is exactly 1. This implies that as one security moves, either up or down, the othersecurity moves in lockstep, in the same direction. A perfect negative correlation means that two assetsmove in opposite directions, while a 0 correlation implies no relationship at all. Excess return is calculatedas the index’s total return less the return of a duration‑matched U.S. Treasury security. Investment‑gradeand high yield corporate excess returns are based on Bloomberg U.S. Corporate Investment Grade andU.S. Corporate High Yield indices.
Inflation Should Moderate, but Uncertainty Remains
Inflation has made a big move higher recently, but current levels appear to be starting to moderate as well‑publicized price jumps related to reopening—such as in used cars and airfares—show signs of receding. While uncertainty about longer‑run inflation remains high, we think that inflation expectations should remain under control as pandemic‑influenced price components ultimately fall back to earth.
With that said, inflation could potentially stay elevated into the fall, which could then prompt the Fed to accelerate its plans to taper bond purchases and raise rates. Much depends on economic data as we approach the fourth quarter and markets try to determine to what degree the delta variant will weigh on growth and continue to disrupt global supply chains. This ongoing uncertainty about the interaction of COVID‑19 trends, economic data, and global central banks removing monetary accommodation is likely to create volatility in rates and credit markets.
Flexibility to Tactically Adjust Duration
A key part of our active portfolio management approach, the flexibility to adjust duration2 in the strategy is essential in this volatile environment. When U.S. economic growth was still accelerating in early 2021, we maintained a shorter‑than‑benchmark duration position, which helped dull the negative price effects of increasing yields. With rates falling from their March highs and appearing likely to remain in a relatively narrow trading range for the short term as of late August, we have moderated the relatively short duration positioning to retain some of the hedge against a potential increase in yields while having more of an opportunity to participate in a further rally.
Because high‑quality government debt has tended to rally in periods of deteriorating risk sentiment, we believe duration can also serve as a hedge against credit risk. Some observers have questioned the effectiveness of duration as a hedge for credit risk with Treasury yields at levels that are low by historical standards, reasoning that Treasuries have limited room to rally.
We think that Treasuries will continue to be useful as a hedge against a steep sell‑off in credit and other riskier assets, like equities. As a result, adding duration can potentially allow investors to have more exposure to credit risk, with all else equal.
Relative Value Opportunities Across Sectors
A multi‑sector portfolio management approach allows the freedom for relative value comparisons across fixed income sectors. An investment‑grade corporate bond often trades differently from a similarly rated municipal bond or asset‑backed security (ABS). To a larger extent than equity markets, fixed income markets are fragmented and tend to have investors that are narrowly focused on a sector or asset class niche. This can lead to technical pressure where some dedicated funds receiving inflows will buy because they have to put cash to work, resulting in disparate cross‑sector relative value. More diversified portfolios that employ a multi‑sector approach can try to capitalize on these relative value dislocations.
Along with building portfolios that diversify credit risk across sectors, we can also make tactical allocation adjustments when we identify possible relative value opportunities. These dislocations can also occur within credit sectors when our internal credit analyst teams have a meaningfully different view of the credit quality of an issuer, a subsector, or an industry compared with external research.
As an example, the US Total Return Bond Strategy can have meaningful out‑of‑benchmark allocations to high yield bonds and bank loans, where we rely heavily on the work of our high yield credit analysts. The team uses extensive proprietary fundamental research in aiming to expose and exploit value dislocations in these markets.
Seeking to Exploit Persistent Inefficiencies
Fixed income markets also feature some long‑lasting inefficiencies that persist despite being well understood by many market participants. Most of these inefficiencies result from imbalances between supply and demand or from investor constraints. There are also market participants with objectives other than maximizing total return, such as institutions constrained by tax considerations and those that have yield‑driven performance targets.
Our quantitative research team has identified some of these anomalies and tested their robustness in various macro scenarios. As long as we have a relatively high degree of confidence that these inefficiencies will persist in the longer term and that they are appropriate for our investor base, we try to take advantage of them. Seeking to capitalize on these inefficiencies while constructing a diversified, risk‑balanced portfolio forms the basis of our strategic asset allocation and portfolio positioning. At the same time, we are aware that there are certain transient environments where positioning to exploit these anomalies could weigh on performance, and we strive to anticipate these shorter‑term shifts and tactically adjust exposures appropriately.
Shorter‑Term Corporates Outperformed
(Fig. 2) Information ratio on excess return by maturity and credit rating*
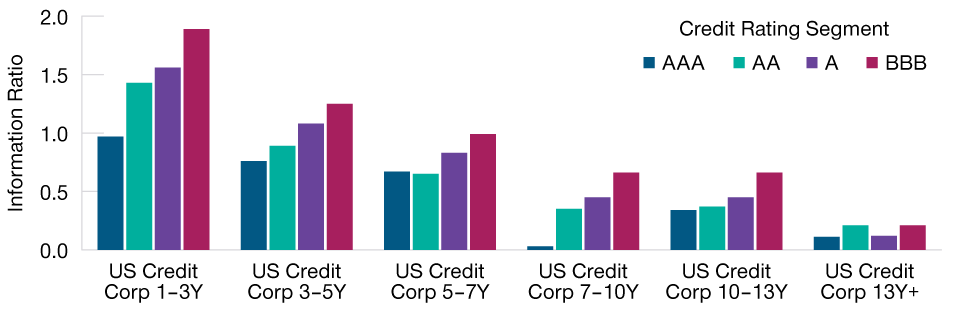
March 31, 1998, through June 30, 2021
Past performance is not a reliable indicator of future performance.
Source: Bloomberg Index Services Limited. Calculations by T. Rowe Price.
*The information ratio measures returns beyond the returns of the broad index compared with the volatilityof those returns. The broad index is the Bloomberg U.S. Corporate Investment Grade Index.
Potential areas of structural inefficiency:
- Shorter‑maturity investment‑grade corporate bonds historically have exhibited much higher risk‑adjusted returns than longer‑term corporates. Portfolios can hold a credit curve steepener—overweights to shorter‑duration corporate credit and underweights to longer‑duration corporates—to try to capitalize on this structural inefficiency.
- We have also observed that credit derivatives tend to perform better than cash bonds in credit sell‑offs, and it can be advantageous to replace some cash bond exposure with credit derivatives when the “basis”—the difference in spread between cash bonds and derivatives—is especially tight. Credit derivatives are typically more efficient than cash bonds in general.
- In another example, credit quality constraints prevent some investors from holding non‑investment‑grade securities. When a bond is downgraded from investment grade into the high yield universe, forced selling from these investors can push prices lower than what the bond’s fundamentals would dictate. We try to capitalize on the relative value that can often be found in these “fallen angels.”
- Securitized credit, which includes commercial and non‑agency residential mortgage‑backed securities and collateralized loan obligations (CLOs) in addition to ABS, is another area of structural inefficiency. Some investors were restricted from owning securitized debt after the global financial crisis, and some lack the ability to analyze the often complex cash flow structures of the securities. T. Rowe Price’s team of securitized credit analysts have the capability to value these bonds, allowing us to locate what we believe are attractive securities and segments that other investors may overlook.
Flexible Multi‑Sector Approach
On a broader level, we believe the income and relatively low volatility of a fixed income allocation make it an important part of a broader portfolio’s asset allocation. In the US Total Return Bond Strategy, we seek to combine well‑diversified sector allocation with tactical insights to pursue consistent risk‑adjusted returns across different types of market environments. Our flexible multi‑sector approach to managing the portfolio allows us to actively manage relative duration and try to take advantage of relative value among sectors.
It must be mentioned that the platform we have on hand at T. Rowe Price is invaluable when facing challenging market conditions. As a firm, we have tremendous expertise around the globe, reaching across the capital structure from investment‑grade debt to equity, across all sectors, across macro and micro, and across fundamental and quantitative. In our view, these resources are a major advantage in managing a multi‑sector fixed income portfolio when it comes to everything from navigating changing market dynamics to constructing durable portfolios to just plain old fundamental security selection.
What We're Watching Next
Environmental, social, and governance (ESG) analysis is an integral part of our fundamental credit research process. T. Rowe Price’s proprietary ESG research tools identify credits with potential ESG-related issues, which our analysts and portfolio managers may incorporate into investment theses, internal credit ratings, price targets, and position sizingas appropriate to their strategy.
Important Information
This material is being furnished for general informational and/or marketing purposes only. The material does not constitute or undertake to give advice of any nature, including fiduciary investment advice, nor is it intended to serve as the primary basis for an investment decision. Prospective investors are recommended to seek independent legal, financial and tax advice before making any investment decision. T. Rowe Price group of companies including T. Rowe Price Associates, Inc. and/or its affiliates receive revenue from T. Rowe Price investment products and services. Past performance is not a reliable indicator of future performance. The value of an investment and any income from it can go down as well as up. Investors may get back less than the amount invested.
The material does not constitute a distribution, an offer, an invitation, a personal or general recommendation or solicitation to sell or buy any securities in any jurisdiction or to conduct any particular investment activity. The material has not been reviewed by any regulatory authority in any jurisdiction.
Information and opinions presented have been obtained or derived from sources believed to be reliable and current; however, we cannot guarantee the sources’ accuracy or completeness. There is no guarantee that any forecasts made will come to pass. The views contained herein are as of the date written and are subject to change without notice; these views may differ from those of other T. Rowe Price group companies and/or associates. Under no circumstances should the material, in whole or in part, be copied or redistributed without consent from T. Rowe Price.
The material is not intended for use by persons in jurisdictions which prohibit or restrict the distribution of the material and in certain countries the material is provided upon specific request. It is not intended for distribution to retail investors in any jurisdiction.
USA—Issued in the USA by T. Rowe Price Associates, Inc., 100 East Pratt Street, Baltimore, MD, 21202, which is regulated by the U.S. Securities and Exchange Commission. For Institutional Investors only.
© 2025 T. Rowe Price. All Rights Reserved. T. ROWE PRICE, INVEST WITH CONFIDENCE, and the Bighorn Sheep design are, collectively and/or apart, trademarks of T. Rowe Price Group, Inc.