Skip to content
Search
By   Tongai Kunorubwe, CFA, Aaron Gifford, CFA, Bridget Mitchell
Download the PDF

El Niño returns: From climate signal to sovereign risk

A very strong El Niño could have highly uneven effects across sovereigns

September 2026, ESG

Key Insights
  • A very strong El Niño could have highly uneven effects across sovereigns. The investment impact will depend less on the headline classification than on where and when physical anomalies emerge and how they transmit through each economy.
  • Exposure is not the same as vulnerability. Food and energy systems, hydropower reliance, fiscal and external buffers, infrastructure resilience, and policy credibility can determine whether a physical shock is absorbed or amplified.
  • The collaboration between T. Rowe Price and Johns Hopkins University aims to better incorporate financially material physical climate considerations into sovereign investment analysis by combining weather, crop, and hydrological analysis with sovereign macroeconomic analysis of growth, inflation, policy, and market pricing.

This work draws on our ongoing research collaboration with Johns Hopkins University's Earth and Planetary Sciences and Civil and Systems Engineering departments, as part of our broader effort to further incorporate financially material physical climate considerations into our proprietary sovereign macroeconomic research, responsible investing analysis, issuer engagement, and investment process.

March 2023 brought an extreme coastal El Niño in the far eastern Pacific off Peru and Ecuador. This localized coastal event was distinct from the broader basin-wide El Niño that developed later in 2023. It flooded parts of northern Peru, damaging infrastructure and disrupting agriculture, fisheries, and other economic activity. The macroeconomic effect was material, but Peru’s low public debt, substantial international reserves, and established policy frameworks provided buffers against a more severe sovereign financing shock. The episode illustrated that significant physical and economic damage does not necessarily translate proportionately into sovereign market stress.

The data suggest that El Niño is already underway and strengthening, with a high probability of a very strong event later in 2026. The duration of the event and its regional weather impacts remain uncertain. For sovereign investors, the key question is how these shocks could propagate through food and power systems, inflation, fiscal accounts, and external balances, and whether individual countries have sufficient buffers to absorb them. Importantly, the economic consequences of El Niño are highly uneven. Severe weather events may be manageable in one country but generate significant inflationary, fiscal, or external pressure in another.

The risks may be amplified because this cycle follows successive shocks to public finances, supply chains, and food and energy markets, including the pandemic, Russia’s invasion of Ukraine, and more recent geopolitical disruption in the Middle East. Many sovereigns now face higher debt‑servicing burdens and less fiscal flexibility, increasing the fiscal and policy cost of responding to renewed food and energy inflation.

The evidence base linking El Niño‑related climate shocks to sovereign markets is emerging but remains geographically limited and less mature than the broader literature linking climate and weather shocks to macroeconomic outcomes. The nature and severity of weather impacts can vary substantially across countries. For sovereign investors, the key question is which El Niño transmission channels are likely to prove most financially material, including through food inflation, hydropower and energy stress, weaker growth, and deteriorating fiscal and external balances. Persistent inflationary pressures may delay monetary easing or necessitate additional policy tightening, while political or social pressures may also rise.

T. Rowe Price and Johns Hopkins University have established an ongoing research collaboration to incorporate financially material physical climate science into sovereign analysis. The current phase of the research examines how different El Niño-Southern Oscillation (ENSO) states influence temperature, precipitation, hydrology, and agriculture across an initial group of 12 priority sovereigns identified by T. Rowe Price. T. Rowe Price and Johns Hopkins University jointly assess how those physical signals could transmit through macroeconomic fundamentals, fiscal and external balances, policy responses, institutional resilience, and market pricing. Together, we believe that this work will continue to provide important input into country‑level sovereign research across credit, local rates, and currencies.1

What is ENSO and why could this cycle matter?

ENSO is a recurring fluctuation in sea‑surface temperatures and atmospheric pressure across the equatorial Pacific. El Niño is the warm phase and La Niña the cool phase. ENSO can alter the odds of drought, flooding, extreme heat, and different storm patterns across every continent.

El Niño events recur at irregular intervals, typically every two to seven years.2 They often begin developing during the Northern Hemisphere spring or summer, strengthen through the autumn, and peak between November and January. The magnitude of El Niño events can vary considerably. A very strong El Niño is relatively rare. Such events are sometimes referred to as “super El Niño” in popular commentary, although this is not a standardized scientific classification. A very strong event is characterized by sea surface temperatures in a key region of the tropical Pacific, known as the Niño 3.4 region, reaching at least 2°C above average over a three-month period.

A very strong El Niño does not automatically mean a larger economic shock

As of August 13, 2026, El Niño was strengthening, with the National Oceanic and Atmospheric Administration (NOAA) assigning a greater than 90% probability to a very strong event during the Northern Hemisphere autumn and winter. NOAA’s August strength forecast assigned a 95% probability to a very strong event during October to December and a 90% probability during November to January (see Figure 1). While stronger events increase the likelihood of some characteristic El Niño impacts, they do not determine the severity of local weather or economic outcomes. We therefore treat even a very strong El Niño as a risk scenario, not shorthand for a uniformly severe weather, economic, or market shock.

NOAA sees a high probability of a very strong El Niño by late 2026

(Fig. 1) Probability by forecast ENSO strength, based on NOAA’s August 2026 outlook

Source: NOAA Climate Prediction Center, August 2026.
Note: The chart shows NOAA’s forecast probabilities for different ENSO states and levels of El Niño strength. Event strength refers to ocean‑temperature anomalies and does not directly determine the severity of regional weather or economic effects. Strength categories are based on NOAA’s Relative Oceanic Niño Index for the Niño 3.4 region. Probabilities may not sum to 100% because of rounding.
Actual future outcomes may differ materially.

For office use only: 202609-5932561

From climate signal to sovereign risk

For sovereign investors, the weather event is only the first step. El Niño does not change country risk directly. Rather, it changes the probability distribution of investment outcomes by altering the likelihood of weather shocks that may or may not transmit through the economy. El Niño climate shocks can cascade through food, energy, fiscal, external, and political transmission channels, as seen in Figure 2. This cascade has the potential to produce materially different economic and financial outcomes depending on each country’s structural vulnerabilities and policy buffers. For example, drought has the potential to reduce crop output and reservoir inflows while flooding can damage transport links and other infrastructure, and warmer coastal waters can disrupt fisheries.

How climate signals become sovereign risk

(Fig. 2) Illustrating the principal transmission channels through which ENSO‑related climate shocks may transmit into sovereign fundamentals and market outcomes

Climate signal Physical impacts Macroeconomic transmission Policy response and buffers Sovereign and market outcomes
  • Drought and heat
  • Heavy rainfall and flooding
  • Ocean warming and storm disruption
  • Low reservoir levels
  • Crop losses
  • Hydropower shortfalls
  • Infrastructure damage
  • Supply chain disruption
  • Food and utility inflation
  • Slower growth and weaker incomes
  • External balance pressure
  • Fiscal and quasi-fiscal costs
  • Foreign exchange reserves and fiscal space
  • Food stocks and import capacity
  • Energy system flexibility
  • Policy credibility and adaptation capacity
  • Rates and foreign exchange repricing
  • Wider sovereign risk premia
  • Debt sustainability pressure
  • Relative value opportunities

Source: T. Rowe Price analysis, informed by the T. Rowe Price‑Johns Hopkins University ENSO research collaboration.
Note: For illustrative purposes only, actual outcomes may differ. The channels are neither linear nor mutually exclusive. Policy responses can absorb, amplify, or transfer risk between household, corporate, external, and public sector balance sheets. For example, subsidies may reduce near‑term inflation while increasing fiscal costs, while foreign exchange reserves can support imports but weaken external buffers.

The magnitude and timing of these effects are crucial. The financial impact emerges when the physical effects pass through to food and electricity prices, economic activity, trade, public finances, and policy credibility, and then into local rates, currencies, and hard‑currency debt.


Cocoa illustrates how climate exposure could become financial risk

The transmission framework illustrated in Figure 2 can be seen in agricultural commodity markets. El Niño can increase the risk of weaker cocoa production in West Africa, but it does not automatically imply another 2023/24‑style price shock. The outcome will depend on realized rainfall, disease, pod development, and crop arrivals, as well as inventories, demand, and the ability of supply elsewhere to offset any shortfall. Compared with 2023/24, the current cocoa market may enter this El Niño cycle with a somewhat stronger starting position. However, whether that translates into greater resilience will depend on realized production, crop arrivals, inventories, grindings, and demand, rather than the El Niño signal itself.

For cocoa-exporting sovereigns, weaker production could reduce export earnings, foreign‑exchange availability, fiscal revenues and rural incomes, although higher cocoa prices may partly offset lower volumes. For corporate issuers, procurement and hedging can delay the impact on margins and cash flow. The investment question is therefore whether adverse crop conditions become sufficiently severe and persistent to weaken these buffers and transmit the climate shock into sovereign fundamentals and market pricing across sovereign debt, local rates, and currencies.


Why country outcomes differ

Exposure to El Niño can indicate where drought, flooding, and other physical effects may occur. Sovereign vulnerability depends on whether those physical effects reach inflation, growth, fiscal and external accounts, and policy credibility—and whether the country has sufficient buffers to absorb them.

Countries with high food consumer price index (CPI) weights, substantial hydropower dependence, climate‑sensitive export sectors, limited fiscal flexibility, or weak external buffers may be particularly vulnerable to stagflationary dynamics, in which inflation rises while growth weakens.

Hydropower disruption could be an especially important transmission channel during the current El Niño cycle, given the heavy reliance on hydroelectricity across several emerging markets. Hydropower accounts for a significant share of electricity generation in Zambia, Colombia, Brazil, and Vietnam. Prolonged drought can reduce power supply while increasing reliance on thermal generation and imported fuel, adding to electricity prices, external financing needs, and fiscal pressures.

…acute ENSO impacts are highly heterogeneous with outcomes shaped by country-specific vulnerabilities.

Tongai Kunorubwe, CFA
Director of Research, Responsible Investing

Building on our work with Johns Hopkins University, acute ENSO impacts are highly heterogeneous with outcomes shaped by country-specific vulnerabilities. We assess ENSO vulnerability through three linked questions:

  • Where is the economy structurally exposed? This includes the importance of climate‑sensitive sectors, food prices in the inflation basket, hydropower reliance, and commodity export concentration.
  • How could the shock pass through the economy? Key factors include dependence on imported food and energy, external financing requirements, and the potential effects on inflation, growth, fiscal accounts, and the external balance.
  • How much capacity does the sovereign have to absorb it? Relevant buffers include foreign exchange reserves, fiscal space, policy credibility, central‑bank independence, infrastructure resilience, and disaster preparedness.

The 2023/24 cycle illustrates different forms of resilience. Peru experienced substantial disruption to fisheries, agriculture, infrastructure, and other activity, but strong financial buffers and credible macro policies in place reduced the risk that these effects would become a sovereign financing shock. Indonesia faced food price pressure, but rice imports, logistics, and active supply management helped moderate the domestic inflation transmission. The cases therefore highlight different buffers: Balance sheet and policy credibility in Peru, and food security and supply management in Indonesia.

Zambia was more vulnerable because several channels overlapped. Drought affected rain‑fed agriculture and hydropower simultaneously, materially reducing available electricity. The effects were uneven: Electricity access was prioritized for mining and larger power users, while households and smaller businesses absorbed a greater share of the load shedding. The resulting power shortages weakened activity and contributed to inflationary and fiscal pressures.

The implications are not uniformly negative. Our collaborative research with Johns Hopkins University has highlighted that some countries may benefit on a relative basis from improved agricultural conditions, lower winter heating demand, or stronger commodity export pricing. We believe assessing ENSO risk therefore requires a country‑specific view.

From climate probabilities to sovereign vulnerability

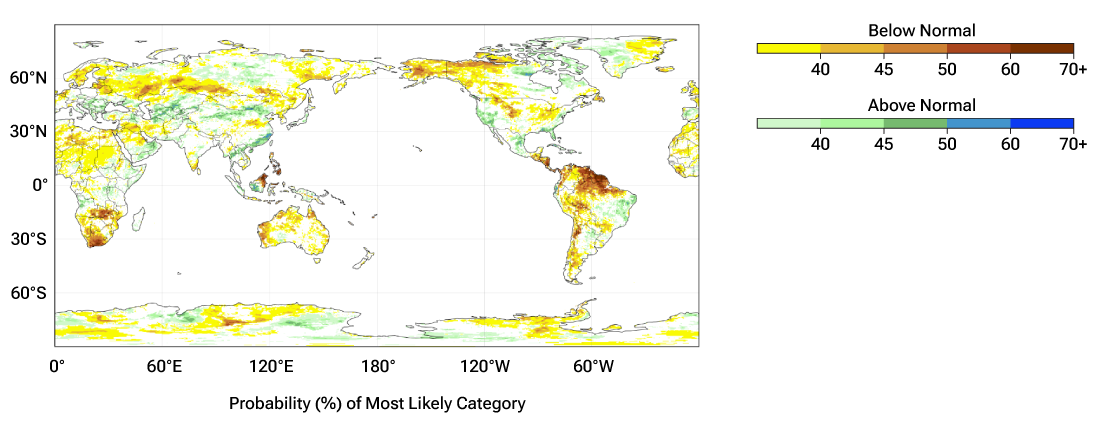
As part of the research collaboration, Johns Hopkins University has developed a teleconnection model drawing on historical climate data (see Figure 3 for an illustrative example of the model). The model estimates how the probability of climate variables such as above- or below-normal temperature and precipitation has varied by country, subregion, and season during previous El Niño events. The results do not predict the realized weather outcome of any individual cycle. Instead, they help analysts identify where particular physical risks may warrant closer investigation. T. Rowe Price’s sovereign analysts can then assess how those climate conditions might interact with each country’s economic structure and policy buffers.

Historical precipitation patterns associated with El Niño across the initial study countries

(Fig. 3) Historical probability (%) of the most likely above- or below-normal precipitation category during El Niño

World map shows historically likely precipitation patterns during December–February El Niño conditions.

Source: Johns Hopkins University analysis for T. Rowe Price, as of August 13, 2026.
Note: The map shows the historically most likely precipitation category during December to February under El Niño conditions, and is not limited to the 12 priority sovereigns in the initial study. The current sovereign analysis focuses on the 12 countries identified earlier in this paper. Shading outside those countries provides broader geographic context. The map is probabilistic and does not forecast the realized weather outcome of the current cycle.
For illustrative purposes only.

Where risks may be most financially material

The following case studies illustrate how broadly similar climate exposure can raise different investment questions, depending on a country’s economic structure and the strength of its policy response.

Colombia
Food and hydropower in the same shock

  • El Niño‑related drought can reduce agricultural output and reservoir levels. With hydropower supplying a large share of Colombia’s electricity, lower reservoir levels may increase reliance on higher‑cost thermal generation, adding to electricity costs and food‑price pressures.
  • During the 2023/24 cycle, reservoir levels fell sharply, but the electricity system continued to meet demand. Additional generation capacity, thermal generation, and wider system management measures helped limit disruption.
  • Key takeaway for investors: For the 2023/24 cycle, infrastructure resilience and energy‑system flexibility materially reduced sovereign stress relative to earlier fears. For investors today, the key question is whether lower reservoir levels would materially alter inflation, the central‑bank path, and the currency outlook—or become severe enough to affect fiscal and sovereign credit fundamentals. The degree of preparedness will depend on Colombia’s starting reservoir levels, gas availability, grid flexibility, and the approach to tariffs and utility support.

Indonesia and the Philippines
Why similar exposure can produce different outcomes

  • Indonesia and the Philippines can both face food‑supply pressure during El Niño, but their capacity to absorb it differs. During the 2023/24 El Niño, Indonesia used rice imports, improved logistics and active supply management to moderate domestic food price pressures. The Philippines experienced greater food inflation pressure, reflecting its sensitivity to rice prices and imported food and fuel.
  • Today, the Philippines appears more exposed because of its dependence on imported food and fuel, the importance of rice from a Consumer Price Index (CPI) perspective, and more limited fiscal buffers. These factors can produce stronger inflation and pressure on the currency during an El Niño-induced food shortage, potentially requiring the central bank to hike interest rates.
  • Key takeaway for investors: Food‑security buffers, logistics, and trade policy can materially affect inflation pass‑through. These differences may lead to contrasting assessments of monetary‑policy flexibility, currencies, and sovereign risk even when countries face broadly similar climate exposure. Preparedness will depend partly on rice stocks, logistics capacity, subsidy policy, and central‑bank credibility.
How climate research can inform sovereign analysis

(Fig. 4) Translating climate signals into sovereign scenarios

Locate climate signal Refine physical risk Map transmission Test scenarios Apply judgment
  • Country
  • Season
  • ENSO state
  • Rain
  • Heat
  • Soil moisture
  • Streamflow
  • Crops
  • Hydropower
  • Trade
  • Gross domestic product
  • Economic sectors
  • CPI
  • External accounts
  • Fiscal accounts
  • Current data
  • Buffers
  • Institutions
  • Valuation
The assessment is updated as weather, sector data, macroeconomic outcomes, and market pricing evolve.

Note: This is a simplified T. Rowe Price analytical workflow illustrating how outputs from the Johns Hopkins University research collaboration can inform sovereign analysis. It is not a representation of a single model or a mechanical investment process. For illustrative purposes only.

What does this mean for investors?

Beyond the teleconnection analysis shown in Fig. 3, the research also examines soil moisture, runoff, streamflow, and crop‑weighted exposure.3 Together, these tools can help identify where a developing event deserves attention.

The ENSO outlook must then be mapped onto the relevant economy. This includes identifying which crops, reservoirs, power assets, and transport routes lie in affected areas; how dependent the country is on imported food and fuel; how concentrated its export earnings are; and which fiscal or quasi‑fiscal mechanism may absorb the cost. Subnational analysis is important because national averages can conceal concentrated exposure in agriculture, mining, or hydropower.

Building on the initial 12-country phase, the research is expanding to incorporate other climate-exposed sovereigns while considering many important cross‑country economic linkages. As climate teleconnections and macroeconomic relationships evolve over time, the analysis is updated as new climate and economic data become available rather than assuming historical relationships remain constant.4

While the partnership continues to evolve, initial work has already informed analysts and portfolio managers in navigating sovereign risk. The climate and macroeconomic models help to assess the possible direction, timing, and magnitude of an ENSO‑related scenario. Their outputs are considered alongside realized weather and macroeconomic data, central‑bank reaction functions, other policy responses, foreign exchange reserves, fiscal capacity, institutional strength, and market valuation to inform investment risks and opportunities.

Research in practice

Drawing on analysis of the 2023/24 El Niño cycle, T. Rowe Price’s sovereign analysts have incorporated the research into country‑level assessments across sovereign credit, local rates, and currencies. The climate analysis formed part of the broader emerging markets sovereign investment process, helping analysts evaluate how physical climate risks could affect sovereign fundamentals and relative value across countries. The research also informed discussions with institutional clients on the potential implications of climate‑related risks for sovereign bond portfolios.

Drawing on analysis of the 2023/24 El Niño cycle, T. Rowe Price’s sovereign analysts have incorporated the research into country-level assessments across sovereign credit, local rates, and currencies.

Aaron Gifford, CFA
Associate Director of Research, Fixed Income

In one sovereign market, the analysis shifted attention from national rainfall averages to reservoir conditions in the principal hydropower region, prompting analysts to widen the range of inflation scenarios after identifying a greater risk of electricity shortages and higher power costs. Beyond inflation, lower reservoir levels could also disrupt energy‑intensive sectors such as mining, reducing production, export receipts, fiscal revenues, and economic activity, thereby creating an additional transmission channel to sovereign credit risk.

How ENSO risk can differ across sovereign markets

(Fig. 5) The same climate shock can have different implications for local rates, currencies, and hard-currency debt

Local Rates Currencies Hard-currency debt
Could food and electricity inflation alter the timing or extent of monetary easing or tightening? Could higher food and fuel imports weaken the external balance, foreign exchange reserves, or policy credibility? Could reconstruction costs, subsidies, weaker revenues, or lost exports worsen debt dynamics, and are spreads already compensating investors for that risk?

For illustrative purposes only. This simplified framework illustrates how ENSO-related risks may affect different areas of sovereign markets.

From scenarios to market implications

Used carefully, we believe ENSO analysis could help investors separate countries that share physical exposure but differ in transmission, buffers, and market pricing.

The analysis can be updated as realized weather, crop, reservoir, and power data emerge, and as those effects begin, or fail, to reach macroeconomic fundamentals. Investors can then assess the policy response and consider whether current market pricing adequately reflects the evolving scenario.

What to watch next

The 2026/27 El Niño could become a material macroeconomic and market event, but the outcome will depend on geography, timing, and intensity, alongside each country’s starting conditions and capacity to respond. Soil moisture, crop development, reservoir levels, food and electricity inflation, and policy decisions will show whether the climate signal is beginning to reach sovereign fundamentals, and ultimately affect market pricing.

The value of the research lies in bringing more granular climate and hydrological evidence into country‑level sovereign analysis, helping identify where physical disruption may become financially material, which countries have the capacity to absorb it, and whether markets compensate investors for the risk.

Exposure is not the same as vulnerability, and vulnerability is not necessarily the same as mispricing. Even where an ENSO shock weakens fundamentals, the investment conclusion depends on whether local rates, currencies, or sovereign spreads already compensate investors for that risk. As the 2026/27 El Niño event evolves, new data will provide an opportunity to test and refine those scenarios.

Tongai Kunorubwe, CFA Director, Research Aaron Gifford, CFA Assistant Director of Research Bridget Mitchell Associate Analyst
Jun 2026 ESG Article

Diversification and discipline: Building a strong credit strategy with impact

Applying an impact lens relies on the same core disciplines as any actively managed...
By   Matthew Lawton, CFA
Apr 2026 ESG Article

How governance reforms in Asia could support stronger market outcomes

Governance reforms have the potential to unlock long-term value and catalyze positive...
By   Yijiang Wang, Colin McQueen

1 The 12 test sovereigns are Mexico, Indonesia, Brazil, Chile, Thailand, South Africa, India, Colombia, Peru, the Philippines, Egypt, and Kenya.

climate.gov/enso, pmel.noaa.gov/elnino/definitions

3 The crop‑yield model currently covers rice, wheat, maize, and soybeans. It combines historical yield data with temperature and precipitation inputs to assess potential changes in crop yields under different ENSO conditions.

4 The historical sample of ENSO events is small. Teleconnections and economic structures change, forecast skill declines with horizon, and adaptation, trade policy, and institutional responses can materially alter the result. We therefore treat early 2026/27 outputs as directional scenarios, not point forecasts or investment recommendations.

Investment risks
Fixed-income securities
are subject to credit risk, liquidity risk, call risk, and interest-rate risk. As interest rates rise, bond prices generally fall.

International investments can be riskier than U.S. investments due to the adverse effects of currency exchange rates, differences in market structure and liquidity, as well as specific country, regional, and economic developments. The risks of international investing are heightened for investments in emerging market and frontier market countries. Emerging and frontier market countries tend to have economic structures that are less diverse and mature, and political systems that are less stable, than those of developed market countries.

T. Rowe Price cautions that economic estimates and forward-looking statements are subject to numerous assumptions, risks, and uncertainties, which change over time. Actual outcomes could differ materially from those anticipated in estimates and forward looking statements, and future results could differ materially from historical performance. The information presented herein is shown for illustrative, informational purposes only. Any historical data used as a basis for analysis are based on information gathered by T. Rowe Price and from third-party sources and have not been verified. Forecasts are based on subjective estimates about market environments that may never occur. Any forward-looking statements speak only as of the date they are made. T. Rowe Price assumes no duty to, and does not undertake to, update forward-looking statements.

Additional Disclosures

CFA® and Chartered Financial Analyst® are registered trademarks owned by CFA Institute.

Sovereign: For purposes of this material, “sovereign” refers to a national government or country. “Sovereign investments” include government-issued debt and related local interest-rate and currency exposures; they do not include corporate debt or equity, which is discussed separately where relevant.

Hydropower (hydroelectric power): Electricity generated from the movement of water, including through dams, reservoirs, and run-of-river systems.

Risk premia: Additional returns investors require to compensate for risk. Sovereign risk premia reflect the additional compensation investors require for risks associated with a particular government or country.

Thermal generation: Electricity produced using heat, typically from fuels such as natural gas, coal, or oil.

For U.S. investors, visit troweprice.com/glossary for definitions of financial terms.

Please see vendor indices for more information, including definitions and source data: troweprice.com/marketdata.

Important Information

Outside of the United States, this is intended for investment professional use only. Not for further distribution.

This material is being furnished for informational and/or marketing purposes only and does not constitute an offer, recommendation, advice, or solicitation to sell or buy any security.

Prospective investors should seek independent legal, financial and tax advice before making any investment decision. T. Rowe Price group of companies including T. Rowe Price Associates, Inc. and/or its affiliates receive revenue from T. Rowe Price investment products and services.

Past performance is not a guarantee or a reliable indicator of future results. All investments involve risk, including possible loss of principal.

Information presented has been obtained from sources believed to be reliable, however, we cannot guarantee the accuracy or completeness. The views contained herein are those of the author(s), are as of September 2026, are subject to change, and may differ from the views of other T. Rowe Price Group companies and/or associates. Under no circumstances should the material, in whole or in part, be copied or redistributed without consent from T. Rowe Price.

All charts and tables are shown for illustrative purposes only. Actual future outcomes may differ materially from any estimates or forward‑looking statements provided.

The material is not intended for use by persons in jurisdictions which prohibit or restrict the distribution of the material and in certain countries the material is provided upon specific request.

Australia—Issued by T. Rowe Price Australia Limited (ABN: 13 620 668 895 and AFSL: 503741), Level 28, Governor Phillip Tower, 1 Farrer Place, Sydney NSW 2000, Australia. For Wholesale Clients only. 

Canada—Issued in Canada by T. Rowe Price (Canada), Inc. T. Rowe Price (Canada), Inc.’s investment management services are only available to non‑individual Accredited Investors and non‑individual Permitted Clients as defined under National Instrument 45‑106 and National Instrument 31‑103, respectively. T. Rowe Price (Canada), Inc. enters into written delegation agreements with affiliates to provide investment management services. 

DIFC—Issued in the Dubai International Financial Centre by T. Rowe Price International Ltd which is regulated by the Dubai Financial Services Authority as a Representative Office. For Professional Clients only. 

EEA—This material is issued and approved by T. Rowe Price (Luxembourg) Management S.à r.l. 35 Boulevard du Prince Henri L‑1724 Luxembourg which is authorised and regulated by the Luxembourg Commission de Surveillance du Secteur Financier. For Professional Clients only. 

New Zealand—Issued by T. Rowe Price Australia Limited (ABN: 13 620 668 895 and AFSL: 503741), Level 28, Governor Phillip Tower, 1 Farrer Place, Sydney NSW 2000, Australia. No Interests are offered to the public. Accordingly, the Interests may not, directly or indirectly, be offered, sold or delivered in New Zealand, nor may any offering document or advertisement in relation to any offer of the Interests be distributed in New Zealand, other than in circumstances where there is no contravention of the Financial Markets Conduct Act 2013. 

Switzerland—Issued in Switzerland by T. Rowe Price (Switzerland) GmbH, Talstrasse 65, 6th Floor, 8001 Zurich, Switzerland. For Qualified Investors only. 

UK—This material is issued and approved by T. Rowe Price International Ltd, Warwick Court, 5 Paternoster Square, London EC4M 7DX which is authorised and regulated by the UK Financial Conduct Authority. For Professional Clients only. 

USA—Issued in the USA by T. Rowe Price Investment Services, Inc., distributor and T. Rowe Price Associates, Inc., investment adviser, 1307 Point Street, Baltimore, MD 21231, which are regulated by the Financial Industry Regulatory Authority and the U.S. Securities and Exchange Commission, respectively.

Unless otherwise indicated, this material is issued and approved by T. Rowe Price International Ltd, Warwick Court, 5 Paternoster Square, London EC4M 7DX which is authorised and regulated by the UK Financial Conduct Authority. For Professional Clients only.

© 2026 T. Rowe Price. All Rights Reserved. T. Rowe Price, INVEST WITH CONFIDENCE, the Bighorn Sheep design, and related indicators (see troweprice.com/ip) are trademarks of T. Rowe Price Group, Inc. All other trademarks are the property of their respective owners. Use does not imply endorsement, sponsorship, or affiliation of T. Rowe Price with any of the trademark owners.

202609-5810536