
January 2023 / INVESTMENT INSIGHTS
A New Dollar Smile: Where Next for the U.S. Dollar?
Our analysis shows the U.S. dollar is at risk of weakening
Key Insights
- After multi‑year strength, our analysis suggests that the U.S. dollar is at a high risk of depreciating at the current juncture.
- The change in (or momentum of) economic growth and real rates has had a particularly outsized impact when the U.S. dollar reached extremes.
- We highlight how forward U.S. dollar returns tend to become more sensitive to economic growth and real interest rate factors as the dollar becomes more expensive.
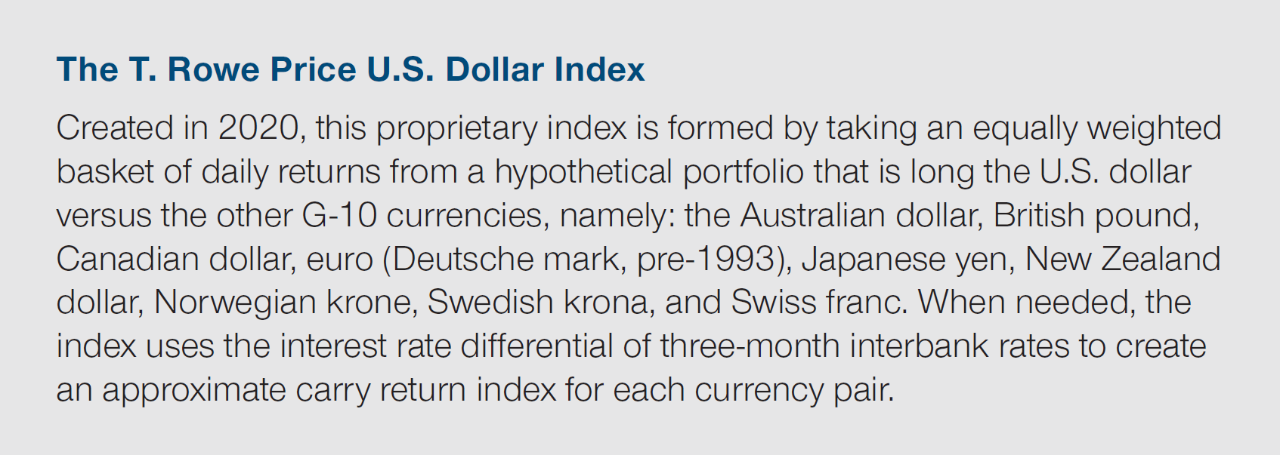
The T. Rowe Price U.S. Dollar (TRP USD) Index
Introduction: The TRP USD index (see pull‑out box below) has appreciated sharply since the lows of the coronavirus pandemic, thanks to exceptional U.S. policies and robust economic growth. In the past 18 months, the index has appreciated by 26%,1 continuing a strengthening trend in the U.S. currency evident since 2014 (Figure 1). This appreciation coincided with the commencement, and subsequent acceleration, of the U.S. monetary tightening cycle; faster U.S. economic growth compared with other advanced economies; and a period of global de‑risking in which U.S. exceptionalism was the norm, and the dollar was the go‑to safe‑haven asset.
As a result of this decade‑long appreciation, the TRP USD index has reached historically high levels, raising questions as to whether the U.S. dollar may be vulnerable to a possible rapid reversal.
In this note, we explore the key drivers of forward2 U.S. dollar returns, focusing on those periods which have seen extreme dollar returns.
Four Key Factors Driving U.S. Dollar Returns
Principally, we examine the role of four likely key factors in driving 12‑month forward U.S. dollar returns, namely:
- Relative U.S. growth: the difference between U.S. economic growth3 and the growth of other G‑10 economies
- Relative U.S. growth momentum: the three‑month change in the U.S. relative growth factor (as described in the previous bullet)
- Relative U.S. real interest rates: the difference between U.S. real 10‑year TIPS4 rates and the real rates of the five other countries with long‑established, inflation‑linked bond markets (Australia, Canada, Germany, Japan, and the United Kingdom)
- Relative U.S. real interest rate momentum: the three‑month change in the U.S. real rate factor (as described in the previous bullet)
From here, we quantify the past sensitivity of the U.S. dollar forward returns to these factors, concentrating particularly on extreme return environments. The key findings from our analysis are as follows:
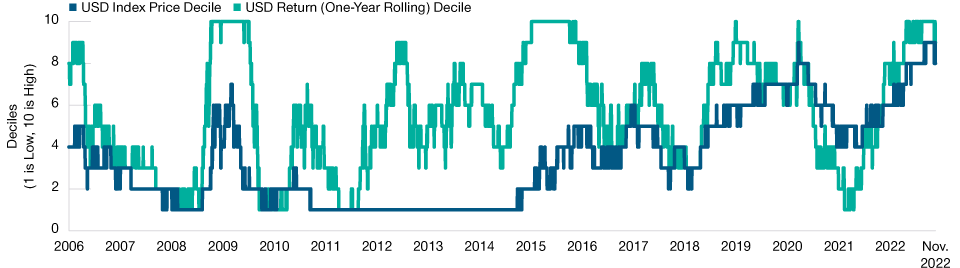
Dollar returns and dollar index analysis: Currently, not only is the dollar expensive, but this has happened rapidly. Both on an index level basis and on a return basis, the current environment is at extremes compared with history. Figure 2 classifies the dollar index as well as the dollar one‑year rolling returns into historical “buckets” or deciles—from low to high. Our index is at the eighth‑highest (of 10) historical valuation decile, while on a return basis, it is at the ninth‑highest dollar returns decile (Figure 2). Dollar returns moved fast too. They experienced a dramatic shift going from the lowest return environment to the highest in just 14 months5 (Figure 2). Going forward, reversals could also occur rapidly.
TRP USD Index
(Fig. 1) The index has appreciated sharply since the pandemic lows
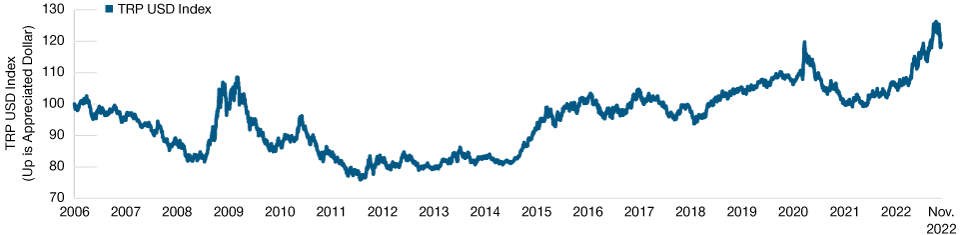
As of November 21, 2022.
Past performance is not a reliable indicator of future performance.
Source: J.P. Morgan/Haver Analytics; T. Rowe Price analysis (see Additional
Disclosure).
TRP USD Index and Dollar Return Deciles
(Fig. 2) Both index and returns are at historically extreme levels
As of November 21, 2022.
Past performance is not a reliable indicator of future performance.
Source: J.P. Morgan/Haver Analytics; T. Rowe Price analysis (see Additional
Disclosure).
Interestingly, periods during which the dollar became expensive coincided with high and accelerating return environments. Also, dollar return inflections led index return inflections.6
What are the Potential Implications for Markets?
- Current U.S. Dollar appears prone to the downside: In the current environment, the U.S. dollar has become increasingly reliant on continued upside surprises to growth and real rates—a difficult feat to continue achieving.
- Dollar sensitivity or betas depend on regime: The sensitivity or beta of dollar returns to growth and real rate factors depends on what dollar return environment we are in (i.e., dollar stronger/dollar weaker environments). Sensitivity to these factors were 2 to 30 times larger at extreme‑dollar‑return environments, than at the mean (see Figure 3 and 4 in next section).7
- Rate of change matters: Changes in relative growth momentum and relative real rates momentum had an outsized impact. When the dollar and dollar returns were at extremely high levels—or in the right tail, as is the case currently—these momentum factors have historically driven returns disproportionately for the next 12 months.
Dollar Drivers at the “Tails”—A New Dollar Smile8
Because the USD moves through various “strong” and “weak” dollar regimes, we have attempted to formally capture how returns have responded to changes in the key fundamental factors. Specifically, we use a regression technique known as a quantile regression, which allows us to split9 the sample into return “regimes” and to capture how forward dollar returns have responded to changes in the factors across the dollar return distribution. What makes this analysis so insightful is that we can robustly analyze the behavior of returns at the tails (i.e., during extreme events) versus behavior during more “normal” environments (i.e., in the middle of the return distribution).
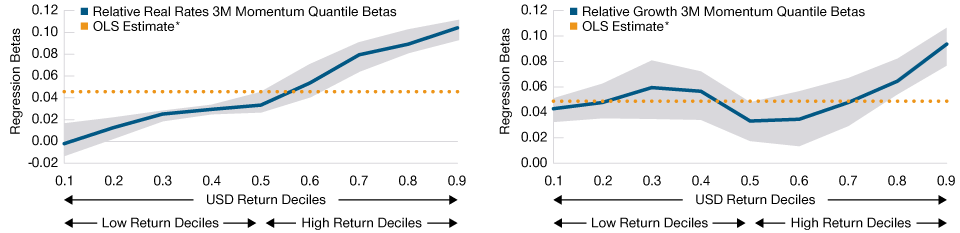
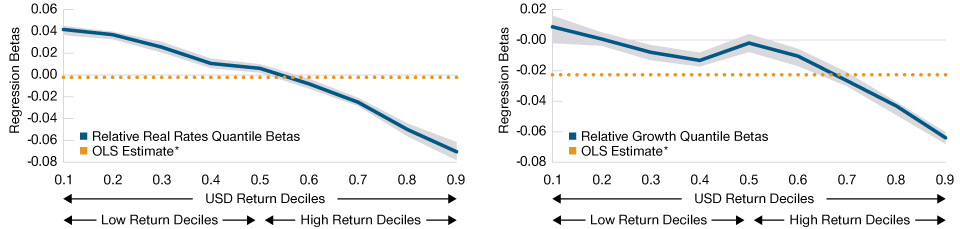
Figures 3 and 4 capture the sensitivity of 12‑month forward dollar returns to the factors during different return environments—captured by dollar return deciles on the x‑axis and the regression coefficients on the y‑axis. The regression coefficients represent the beta of dollar returns to each of the fundamental factors that we consider, estimated jointly (i.e., a multivariate regression).
The analysis shows that dollar forward returns were overly dependent on relative growth momentum and relative real rates momentum (Figure 3). These dependencies increased in magnitude as we went from normal to high return environments. This means that changes in the relative speed of either U.S. economic activity or real rates likely have a disproportionate impact on forward dollar returns when returns are already high. These convexity effects are what we call the “new dollar smile.”
Relative Real Interest Rates and Economic Growth Momentum Factors
(Fig. 3) Quantile regression coefficients on 12‑month forward dollar returns
As of November 21, 2022.
Actual future outcomes may differ materially from the output shown. Changing time periods and other inputs might have a material impact on the results shown.
Analysis period January 2006 to November 2022. Shaded area represents confidence interval for beta estimation.
*Ordinary least squares (OLS) is a regression modelling technique that estimates the distance between the predicted values and the observed values.
Sources: J.P. Morgan/Haver Analytics, and DeepMacro, LLC; T. Rowe Price analysis (see Additional Disclosure).
Relative Real Interest Rates and Economic Growth Differential Factors
(Fig. 4) Quantile regression coefficients on 12‑month forward dollar returns
As of November 21, 2022.
Actual future outcomes may differ materially from the output shown. Changing time periods and other inputs might have a material impact on the results shown.
Analysis period January 2006 to November 2022. Shaded area represents confidence interval for beta estimation.
*Ordinary least squares (OLS) is a regression modelling technique that estimates the distance between the predicted values and the observed values.
Sources: J.P. Morgan/Haver Analytics, and DeepMacro, LLC; T. Rowe Price analysis (see Additional Disclosure).
By contrast, when dollar returns were high, the growth and real rates level factors differential became negative (orange dotted line goes from positive to negative on Figure 4). This means that, for longer forward time horizons, the mean reversion effects were more pronounced for high return environments. This result also explains why the traditional dollar smile emerges: When U.S. growth is sufficiently strong, it can lift the growth of all economies and result in the dollar depreciating as capital flows out of the U.S. and into other economies, taking advantage of subdued risk aversion and in search of stronger returns.
The combination of Figures 3 and 4 has a profound implication for the dollar in the current environment. Dollar returns have been so strong (in the top deciles) that, for appreciation to continue, the U.S. economy also needs to continue to accelerate from this point forward. Importantly, dollar returns become increasingly dependent on momentum factors to continue moving higher.
U.S. Inflation Remains Below Developed Market Peers
(Fig. 5) Inflation factors: U.S. vs. G‑10 (ex U.S.)
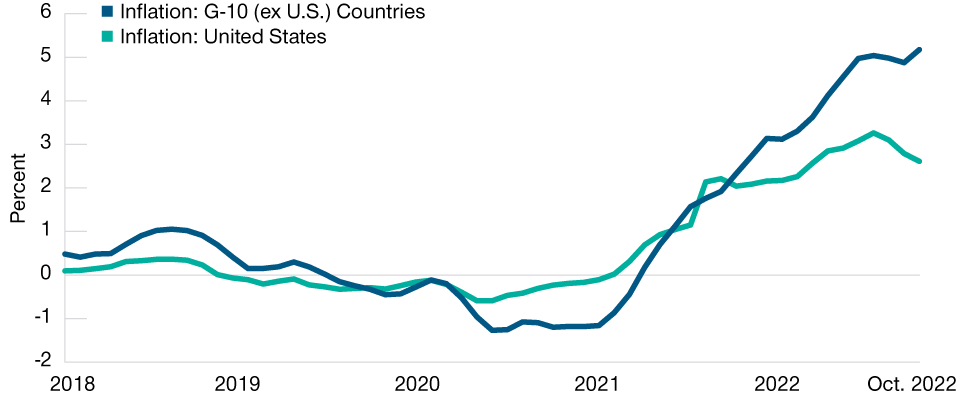
As of October 31, 2022.
The inflation factor estimates are a daily measure of price pressures from DeepMacro, LLC, which produces a high frequency, point-in-time “nowcast” of inflation across over 30 countries.
Source: DeepMacro, LLC/Haver Analytics; T. Rowe Price analysis.
U.S. Monetary Policy Is Tighter Than Developed Market Peers
(Fig. 6) Policy rates: U.S. vs. G‑10 (ex U.S.)
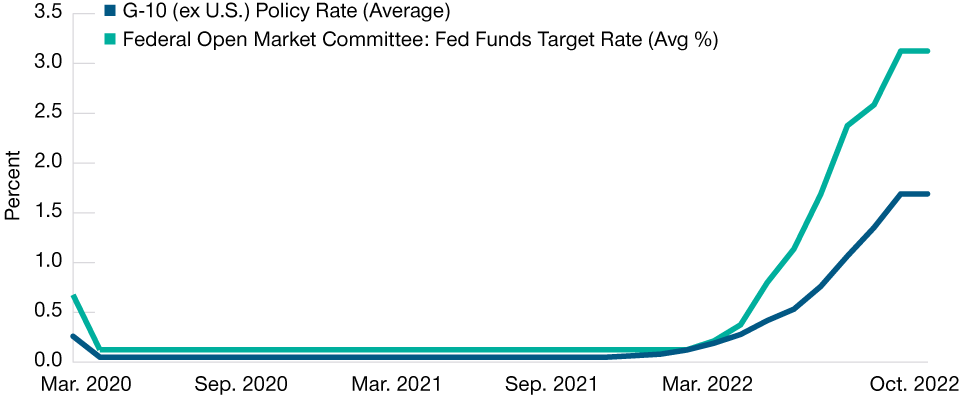
As of October 31, 2022.
Sources: Bank of Canada, European Central Bank, Sveriges Riksbank, Bank of England, Bank of Japan, Federal Reserve Board/Haver Analytics; T. Rowe Price analysis.
Accordingly, this dependence on the momentum factors highlights potential future dollar weaknesses. If we were to see a reversal in the relative speed of either economic activity or real interest rates, then the forward dollar correction could be significant as well as rapid. As it stands currently, dollar supportive factors need to keep outperforming simply to keep the dollar in place. Or, put another way, the hurdle for dollar returns currently is extremely high.
The U.S. Relative to Other Markets
Relative to the U.S., other G‑10 economies currently have higher rates of inflation (Figure 5) as well as easier monetary policy (Figure 6).
Given the monetary policy cycle mismatch that exists between the U.S. and the other G‑10 economies, we believe that there is a high probability that either this policy differential eases, or that U.S. economic activity slows more than in other G‑10 economies, over the next 6–12 months.
Conclusion
We have found that convexity effects in relation to the U.S. dollar are large and that current circumstances point to the asymmetry likely materializing to the downside, as U.S. growth exceptionalism wanes. The dollar has become increasingly reliant on continued upside surprises to economic growth and real rates, a difficult feat to continue. The dependence on these momentum factors, therefore, highlight potential future dollar weaknesses. If a reversal in the relative speed of either economic activity or real rates were to eventuate, then we anticipate a significant, and rapid, downward dollar correction.
Furthermore, we also find that the beta of the dollar returns to growth and real rate factors depend on what dollar return environment we are in, and our analysis shows that it is the changes in relative growth momentum and relative real rates momentum that can have an outsized impact. When the dollar value and dollar returns were at extremely high levels, changes in these momentum factors have historically driven returns disproportionately for the next 12 months.
IMPORTANT INFORMATION
This material is being furnished for general informational and/or marketing purposes only. The material does not constitute or undertake to give advice of any nature, including fiduciary investment advice, nor is it intended to serve as the primary basis for an investment decision. Prospective investors are recommended to seek independent legal, financial and tax advice before making any investment decision. T. Rowe Price group of companies including T. Rowe Price Associates, Inc. and/or its affiliates receive revenue from T. Rowe Price investment products and services. Past performance is not a reliable indicator of future performance. The value of an investment and any income from it can go down as well as up. Investors may get back less than the amount invested.
The material does not constitute a distribution, an offer, an invitation, a personal or general recommendation or solicitation to sell or buy any securities in any jurisdiction or to conduct any particular investment activity. The material has not been reviewed by any regulatory authority in any jurisdiction.
Information and opinions presented have been obtained or derived from sources believed to be reliable and current; however, we cannot guarantee the sources' accuracy or completeness. There is no guarantee that any forecasts made will come to pass. The views contained herein are as of the date noted on the material and are subject to change without notice; these views may differ from those of other T. Rowe Price group companies and/or associates. Under no circumstances should the material, in whole or in part, be copied or redistributed without consent from T. Rowe Price.
The material is not intended for use by persons in jurisdictions which prohibit or restrict the distribution of the material and in certain countries the material is provided upon specific request.
It is not intended for distribution to retail investors in any jurisdiction.