April 2021 / MULTI-ASSET STRATEGY
Inflation Likely to Accelerate: A Non-consensus View
Aggressive stimulus and labor market tightening mean higher inflation risk
Key Insights
- The consensus view sees inflation peaking around April or May and then remaining weak.
- We think this misses the magnitude of the likely rise in prices from aggressive stimulus, rapid labor market tightening, and past underinvestment in commodities.
- Unexpected inflation is a risk. A review of allocations to inflation hedges like real assets may be considered in case inflation remains higher for longer.
Asset and commodity prices have been moving in line with the view that supply constraints and a weaker U.S. dollar are putting incipient pressure on underlying inflation trends. Contrary to the widely held consensus view, we believe inflation pressures are likely to accelerate substantially as 2021 progresses.
The consensus view is that inflation will peak around April or May of this year, largely because of base effects in which inflation has been weak immediately in the wake of the coronavirus pandemic, and energy prices have also slumped. Base effects alone are expected to lift headline consumer price index (CPI) inflation by about 100 basis points to over 2.75%. If the headline CPI rises in line with history, annual inflation could conceivably top 3% by May.
Central bank officials have noted that they, too, expect inflation to drift up solidly in the coming months. Yet, they’ve indicated that they are going to look through this. Federal Reserve Chair Jerome Powell recently expressed no concern about a sell-off in bonds and provided no indication of policy changes ahead. The Fed has further indicated it is unlikely to act, even if inflation rises temporarily to 3% or 3.5%. As a result, we expect that markets will not get too excited about U.S. near‑term inflation prints potentially above 2%.
The consensus view that inflation is unlikely to accelerate is widely shared because inflation, particularly core inflation that the Fed focuses on, is usually suppressed after a recession, particularly one as deep as the COVID‑19 recession.
Our view goes against the consensus. This was not a classic recession, and we think the market is missing the coming magnitude of the cyclical upswing in prices. The pandemic shock was not a classic end‑of‑cycle recession, and the inflation response is likely to be quite different for five reasons:
- Starting conditions not as bad as in previous recessions
- Rapid labor market tightening
- Past underinvestment in commodities
- A rising current account deficit
- Aggressive stimulus adding fuel to the fire
Consumer Price Pressures Haven’t Fallen as Much as in the Past
(Fig. 1) Headline CPI inflation and inflation pressures z‑score
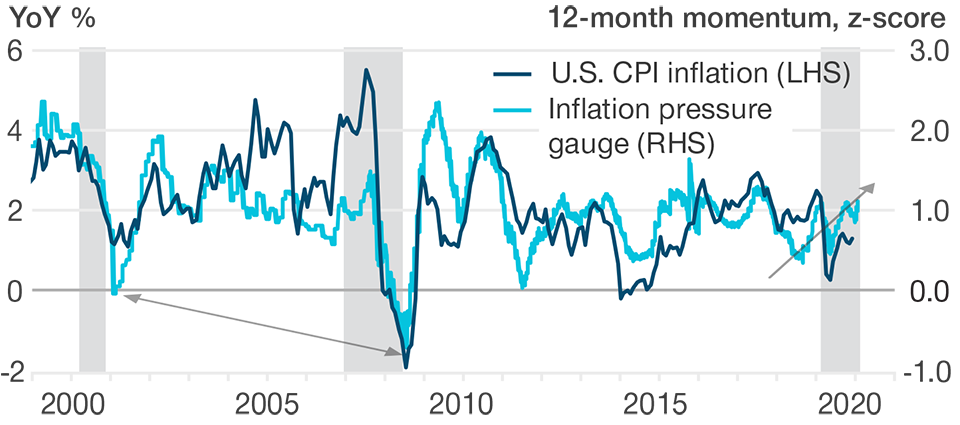
As of February 18, 2021.
Sources: Bureau of Labor Statistics/Haver Analytics; DeepMacro LLC Daily Inflation Pressure Index.
Shaded bars = recession periods.
These five observations on inflation will be important to note for investors because we feel that markets are unprepared for and have not yet priced in a cyclical inflation shock. From the bond market, forward inflation swaps are still only pricing a muted inflation recovery. The five‑year, five year forward rate (5Y5Y) on inflation swaps is only around 2.4%. And this already includes the well‑known rise in inflation because of base effects. Models of the inflation risk premium show that the compensation demanded for future inflation is near record lows from which it can only rise, in our view.
Unexpected inflation is a risk for many investors who might have underinvested in real assets and other inflation-sensitive assets. A review of allocations to inflation hedges like real assets may be considered in case inflation remains higher for longer.
1. Starting Conditions Not as Bad as in Previous Recessions
The starting conditions for inflation are much stronger now than during past recessions. Headline CPI inflation appears out of step with its typical cyclical behavior (see Figure 1). In recessions historically, CPI inflation typically falls sharply, as does the broader price pressure indicator. In 2020, however, headline inflation only fell a little while broader measures of price pressures rose through the year. From this, we deduce that sequential inflation may now rise significantly, especially since many commodity prices (food, metals, and energy) have increased 30% to 40% since the fourth quarter of 2020, according to the Goldman Sachs Commodity price indices (GSCI). Energy prices, in particular, feed rapidly into headline CPI inflation.
Demographic changes imply that the trend labor force participation rate is only around 1.5% above the current level. This leaves little scope for a large pool of labor to weigh on wages, unlike the labor market dynamics in the 2010s, when the participation rate was higher. Any further improvements will likely continue to eat into current labor market slack, leaving the economy exposed to insufficient supply when demand returns, forcing employers to compete for labor via higher wages.
Non‑oil Commodity Prices Rebounded Strongly in 2020
(Fig. 2) GSCI Commodity Indices: Industrial metals, agriculture, precious metals
Spot prices, March 2020 = 100
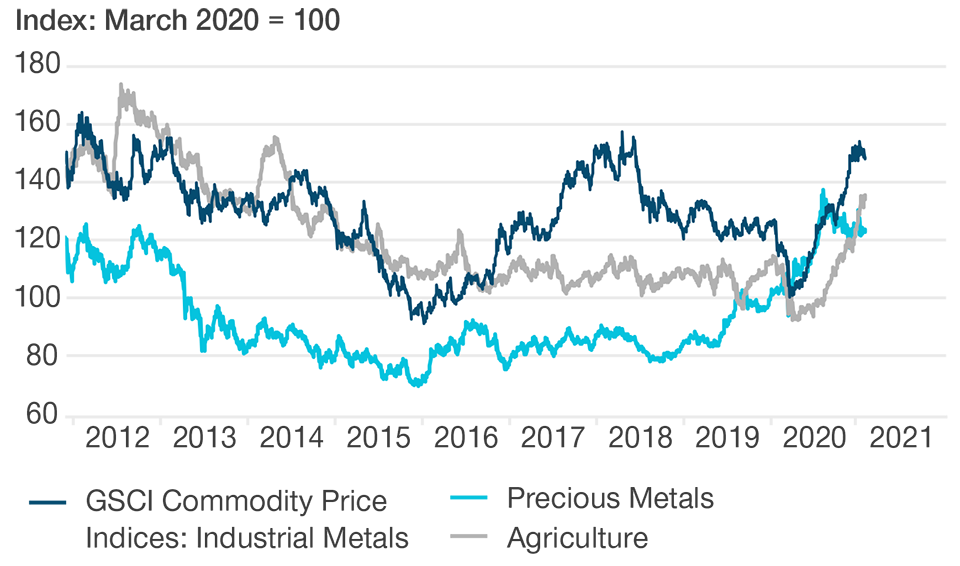
As of February 18, 2021.
Past performance is not a reliable indicator of future performance.
Sources: Standard & Poor’s/Haver Analytics.
Estimates suggest that online shopping, working from home, and other social changes triggered by the coronavirus have brought forward a decade of innovation. This has benefited companies on the right side of this change, but many businesses that were adversely affected have been shut permanently, reducing overall capacity. Cyclically, this has resulted in a very sharp fall in retail inventories, especially of autos. As demand recovers, we think the associated restocking could add over USD 500 billion, potentially boosting U.S. real gross domestic product (GDP) growth by around 5% to 6% per quarter over several quarters, likely returning GDP to its pre‑crisis trend level faster than many expect and closing the output gap.
2. Rapid Labor Market Tightening
From a labor market perspective, the coronavirus shock was very unusual compared with previous recessions. Traditionally, unemployment rockets higher but then falls like a feather during a typical recession/recovery; rising sharply in the first three months of the recession, but then taking two years—or longer—to return to more normal levels of unemployment.
Labor markets are currently tightening at a historically rapid pace, both thanks to rehiring as economies reopen and as an aging population leads to a shrinking working population. By any standard, the current unemployment rate of 6.75% is not typically seen until two to four years after the end of a recession (Figure 3). This time appears to be different. In 2020, it took only eight months for the unemployment rate to get back to 6.75%, and it looks like it could be under 6% by mid‑2021.
Fast Economic Recovery Should Support Inflation
(Fig. 3) Unemployment rate (UR) in percent
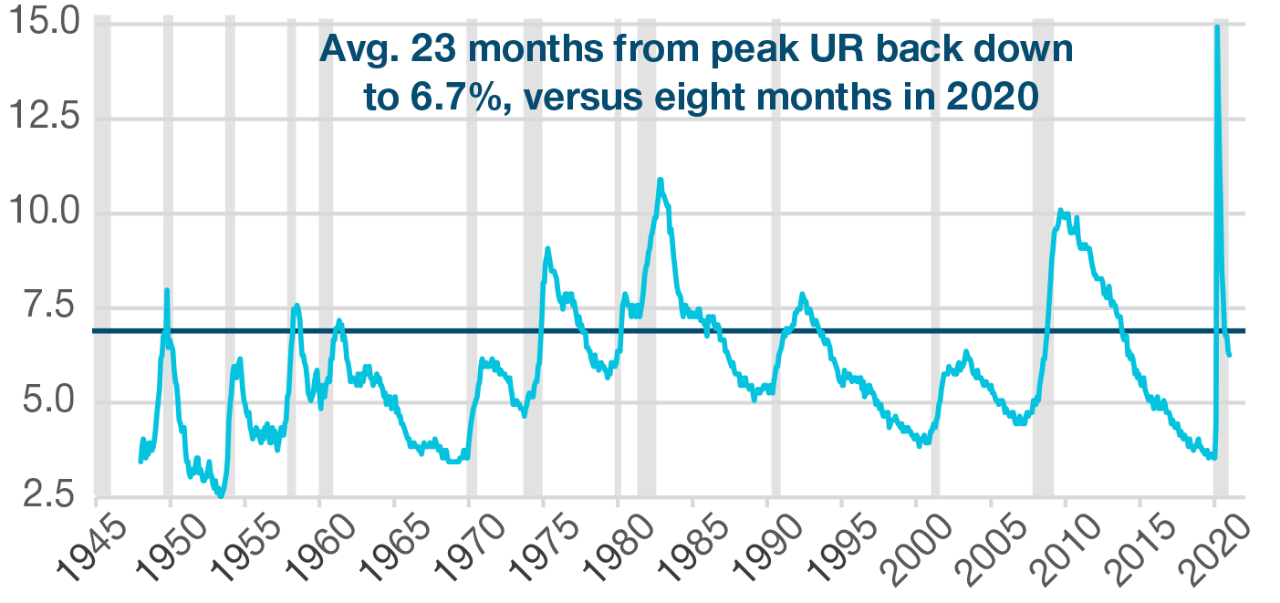
As of February 18, 2021.
Sources: Bureau of Labor Statistics/Haver Analytics.
Horizontal line indicates current level of UR.
Shaded bars = recession periods.
The pandemic shock is more like the recessions after WWII and the Korean War. Unemployment surged then, and professional economists worried that mass demobilizations would push us back into 1930s-style deflation. However, what they missed was that these shocks induced large shifts that drove demand in sectors that had seen little investment. As a result, unemployment swiftly fell and inflation surged, as the postwar economy struggled to adjust to the lack of labor and inadequate supply in new areas of demand.
Finally, we would also observe that the pandemic shock was unusual because of who lost their jobs. Usually, the manufacturing and construction sectors—sources of skilled blue‑collar labor—suffer the most and take the longest to recover. Indeed, after the 2001 and 2008 recessions, blue‑collar employment never recovered, as proxied by the total number of workers in U.S. manufacturing. By contrast, in 2020, blue‑collar employment has snapped back quickly.
Wages Don’t Face Big Pressure From Newly Unemployed
(Fig. 4) Blue‑collar employment back at 95% of coronavirus levels
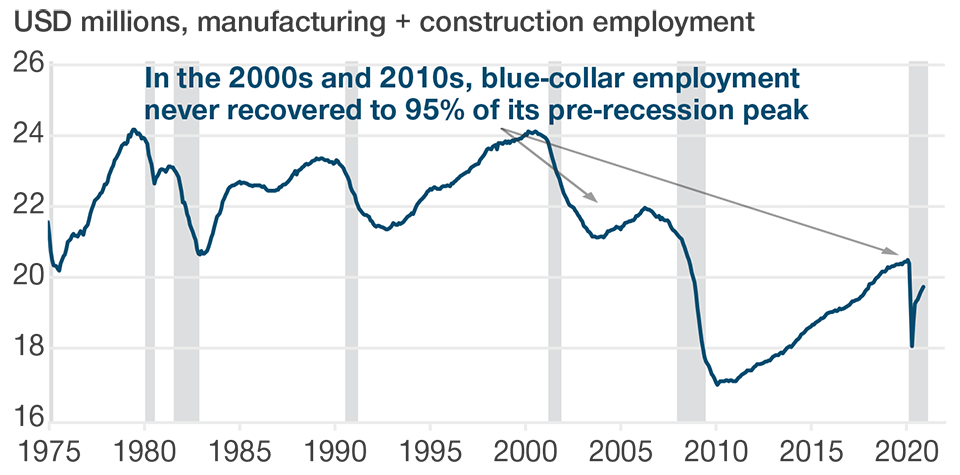
As of February 18, 2021.
Sources: Bureau of Labor Statistics/Haver Analytics.
Shaded bars = recession periods.
Consequently, we think there is likely to be less downward pressure on wages from high unemployment as compared with the 2000s and 2010s. In the first two decades of this century, many blue‑collar workers were forced to take lower-paying service sector jobs, competing with workers already in those industries and driving down wages. After the coronavirus shock, by contrast, manufacturing employment quickly recovered to over 95% of its pre‑crisis level (Figure 4). With generous support from Social Security safety nets, the remaining unemployed blue‑collar workers have fewer incentives to seek work in the coronavirus‑exposed consumer services sectors like entertainment or hospitality at much lower wage rates.
3. Past Underinvestment in Commodities
The commodity sector has also seen weak investment in recent years, suggesting supply conditions could tighten further in 2021 as demand increases amid recovery. Capital discipline in the mining industry, for example, has limited new capex spending, providing producers with pricing power. There are few signs that the recent runup in iron ore prices is prompting a capex response.
Investment in energy (as proxied by the Baker Hughes Rig Count) has also been weak. The shortage of oil rigs means U.S. oil production would likely be slow to respond to a recovery in demand. With current oil consumption about 2 million barrels (per day) above production, inventories are likely to start falling quite rapidly. Moreover, the recent OPEC+ agreement brokered by Saudi Arabia shows a surprising degree of production discipline by oil producers, at least until midyear.
Given this discipline, commodity prices have unsurprisingly surged. These higher raw material input costs should start to feed into sequential inflationary pressures in the coming months.
4. Rising Current Account Deficit in Recession/Inadequate Supply
At the macro level, the widening U.S. current account deficit during a recession tells us there is insufficient domestic supply to meet domestic demand (Figure 5). Traditionally, the external balance improves during a recession, reflecting a shortfall of domestic consumption. Currently, however, consumption has accelerated beyond the ability of the economy to meet demand.
U.S. Current Account Deteriorated in a Recession
(Fig. 5) Current account balance in % of GDP (and excluding petroleum)
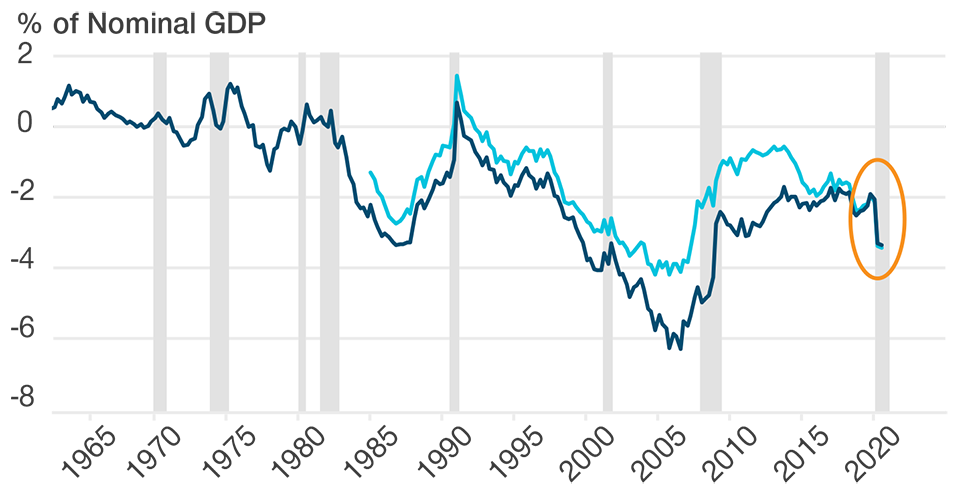
As of February 18, 2021.
Sources: Bureau of Economic Analysis/Haver Analytics.
Shaded bars = recession periods.
A continued rebound would inevitably see a further widening of the deficit, especially since the U.S. runs a deficit in autos (where there has been a key supply shortfall). At the same time, global capacity is also tighter than in the mid‑2000s, as repeated rounds of Chinese supply cuts are leaving Chinese producers with less spare factory capacity. Also, most incremental investment today is going to service depreciation rather than new greenfield productive capacity. As a result, China may become less of a source of global deflation pressures than in the past.
5. Large Positive Fiscal Impulse in 2021
The recently signed American Rescue Plan Act of 2021 (also called the COVID‑19 Stimulus Package) should accelerate the recovery even more as the relief provisions are overwhelmingly geared toward low‑income and middle‑class Americans who are more likely to spend. The USD 1.9 trillion package will also be largely spent within 2021. We regard the U.S. economy as already closing its output gap and running tighter than many commentators suspect. These forces were already well in train before the initial impact of fiscal stimulus had been felt. We believe this very large positive fiscal impulse in 2021 will erode labor market slack ever more quickly.
Internationally, non‑oil commodity demand is strong, buoyed by the recovery in global trade and domestic Chinese demand, especially for infrastructure and housing, which are expected to remain resilient in 2021. Globally, the quantity of fiscal stimulus has been less in the eurozone and China compared with America. While demand has slowed more sharply in Europe, Chinese growth has remained resilient and is already back to its pre‑pandemic trend, which reduces the risk of deflation pressure building.
External Weakness and Inflation Led to a Weaker Dollar
(Fig. 6) The U.S. dollar factor, 1973 to present1

As of February 18, 2021.
Past performance is not a reliable indicator of future performance.
Source: Bureau of Economic Analysis.
1 Total return index of an equally weighted basket of USD versus G-10 currencies, rebased to 1973 = 100. Higher numbers = USD appreciation.
What Are the Risks to Our Non‑consensus View?
1. Vaccine versus mutations
In the near term, renewed worries about the coronavirus could come back to weigh on economic activity. In Europe and China, the authorities renewed travel and quarantine restrictions as new waves of infections peaked. There are worries that new mutations of the virus potentially could reduce the efficacy of vaccines, though, so far, there is thankfully no evidence of this.
2. Long‑term trends
There have been significant structural forces that explain the low inflationary environment. Globalization, productivity enhancements in oil production, and price discovery enabled by technology will not disappear anytime soon. This might lead to lower inflationary pressures than expected.
3. Chinese policy over‑tightening
We are also watching credit developments in China as policy over‑tightening there would be a key risk to the global inflation outlook. The coordinated central bank easing in 2020 saw a modest uplift in credit but came on the back of fiscal stimulus that was four times the size of the fiscal boost during the GFC. This helped to buoy consumer spending and employment in 2020. Additionally, the mix of fiscal and monetary stimulus in developed markets is unlike the mid‑2010s, when we saw fiscal tightening offsetting central bank easing—a mix that preempted an enduring recovery in commodities. The current policy stance, if sustained in 2021, should help to support a strong recovery in real assets, unlike in the 2010s.
4. Stronger U.S. dollar
Price pressures in the U.S. are also likely to receive a modest fillip from a weaker currency. There are longer‑term pressures for the U.S. dollar to decline, owing to narrowing growth and interest rate differentials, high U.S. fiscal and current account deficits, and ample U.S. dollar liquidity. However, if the U.S. dollar appreciates on the back of a roaring economy, inflation might be tempered.
IMPORTANT INFORMATION
This material is being furnished for general informational and/or marketing purposes only. The material does not constitute or undertake to give advice of any nature, including fiduciary investment advice, nor is it intended to serve as the primary basis for an investment decision. Prospective investors are recommended to seek independent legal, financial and tax advice before making any investment decision. T. Rowe Price group of companies including T. Rowe Price Associates, Inc. and/or its affiliates receive revenue from T. Rowe Price investment products and services. Past performance is not a reliable indicator of future performance. The value of an investment and any income from it can go down as well as up. Investors may get back less than the amount invested.
The material does not constitute a distribution, an offer, an invitation, a personal or general recommendation or solicitation to sell or buy any securities in any jurisdiction or to conduct any particular investment activity. The material has not been reviewed by any regulatory authority in any jurisdiction.
Information and opinions presented have been obtained or derived from sources believed to be reliable and current; however, we cannot guarantee the sources' accuracy or completeness. There is no guarantee that any forecasts made will come to pass. The views contained herein are as of the date noted on the material and are subject to change without notice; these views may differ from those of other T. Rowe Price group companies and/or associates. Under no circumstances should the material, in whole or in part, be copied or redistributed without consent from T. Rowe Price.
The material is not intended for use by persons in jurisdictions which prohibit or restrict the distribution of the material and in certain countries the material is provided upon specific request.
It is not intended for distribution retail investors in any jurisdiction.
April 2021 / INVESTMENT INSIGHTS