Skip to content
Search
By   Laurence Taylor, CFA, Andrew W. Tang, CFA, CAIA®
Download the PDF

Living in a world of extremes: Why portfolio construction matters more than ever

Explore why rising factor volatility, index concentration, and market dispersion are increasing the importance of disciplined portfolio construction.

October 2026, Equity

Key Insights
  • Markets are facing an unusually complex environment, with factor and industry volatility events in 2026 on track to outpace even 2020, driven by a mosaic of AI, geopolitics, inflation and armed conflict.
  • This environment strengthens the case for portfolio construction methodologies that evaluate, reflect, and diversify the risk conditions inherent in equity markets today.
  • Passive exposure is not necessarily neutral when generational levels of index concentration leave investors increasingly reliant on a small group of market leaders.

Investors have become accustomed to describing markets as anything but typical. Powerful secular themes, geopolitical uncertainty, inflation and technological disruption are interacting with highly concentrated equity benchmarks. Meanwhile, dispersion across stocks, industries and investment styles has also increased. In this environment, how investors manage risk and construct portfolios matters more than ever.

…2026 on pace to record more severe factor events than even 2020.

Laurence Taylor
Portfolio Manager, Equity Solutions

The increase in extreme factor moves since 2020 has underscored the importance of active risk management. After a relatively subdued decade for severe style and industry factor events in the 2010s, the contrast in the 2020s has been striking. Markets have experienced repeated episodes of elevated factor activity since the COVID pandemic, with 2026 on pace to record more severe factor events than even 2020 (Figure 1).

Extreme factor events are becoming more frequent

(Fig. 1) Extreme is an overused word… except when you can measure it 

As of September 30, 2026.
The chart counts factor‑day exceedances per year for the 61 style and industry factors of MSCI Barra’s GEMLTL model. A factor‑day exceedance is one factor, on one day, whose return was more than three standard deviations from that factor’s own historical mean. The y‑axis is the count of such factor‑days in the year. If three factors each breach on the same day, that is three exceedances. Through September 30, 2026 the count is 626, over 195 trading days. This is sourced from MSCI Barra’s published daily GEMLTL factor returns from January 2, 1995. We standardize each daily factor return against that factor’s own history. That history is the mean and standard deviation of all of its returns from its first observation to the previous day.
At least 252 prior observations are required. A factor‑day is an exceedance when the absolute standardized return exceeds three; both positive and negative moves count. Every bar for the 1996 to 2025 count is actual history under this definition. The 1995 bar covers only the last eight trading days of the year, because the 252‑day requirement consumes the rest. The 2026 bar is actual history through September 30. Any projected remainder of the year is an extrapolation at the year‑to‑date daily rate, and we draw it as a separate series. Barra factor returns are statistical estimates from a daily cross‑sectional regression, not traded prices. Estimates are subject to limitations. Actual outcomes may differ from projections materially.
We place each exceedance in one of four severity bands by how far past three standard deviations it went. The bands are 3 to 4, 4 to 5, 5 to 7, and 7 or more. The bands are mutually exclusive and sum to the year’s total. A label reading “with Projection” means that series includes the projected remainder of 2026 as well as the actual count.
Source: MSCI Barra. Analysis by T. Rowe Price. See Additional disclosures.

While the forces driving this new environment are multi‑dimensional—with AI, politics, armed conflict and inflation all impacting markets simultaneously—the investment consequence is clear: greater factor volatility can amplify the rewards for getting portfolio exposures right and the costs of getting them wrong.

Technology, AI and generational index concentration

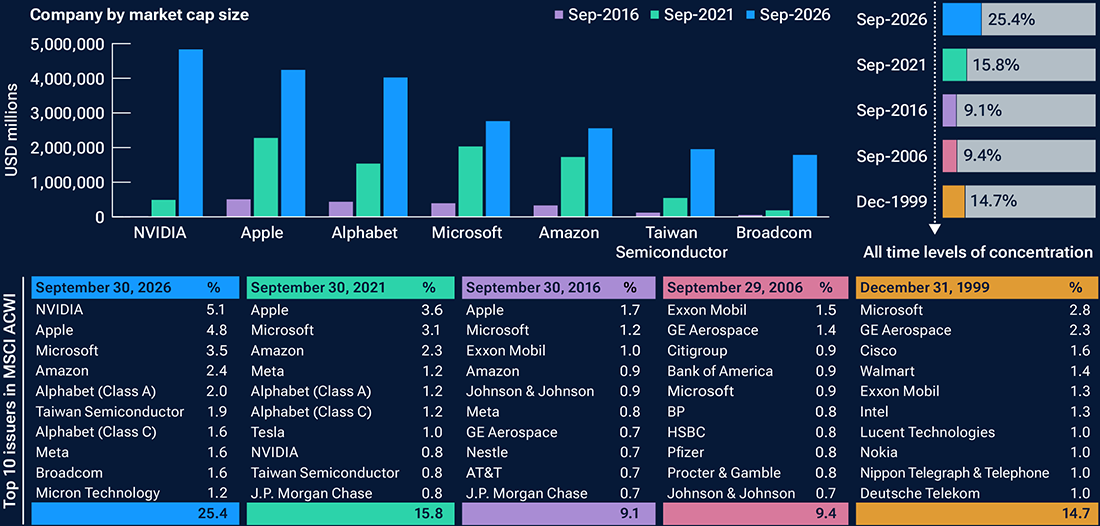
Compounding the challenge is extraordinary index concentration. As of August 31, 2026, the 10 largest issuers represented 24.3% of the MSCI All Countries World Index—well above the 14.7% recorded at the end of 1999 at the height of the technology bubble and the equivalent figure of 9.0% a decade ago (Figure 2). The composition is equally striking, with all ten of today’s largest issuers reflecting the growing concentration of global market leadership around technology and the AI ecosystem.

Global equity concentration is extreme 

(Fig. 2) The 10 largest MSCI ACWI issuers account for almost a quarter of the index, compared with 14.7% at the end of the technology‑led market boom in 1999


As of September 30, 2026.
The specific securities identified and described are for informational purposes only and do not represent recommendations.
Source: www.factset.com: Data and analytics provided by FactSet.

Greater dispersion raises both opportunity and risk

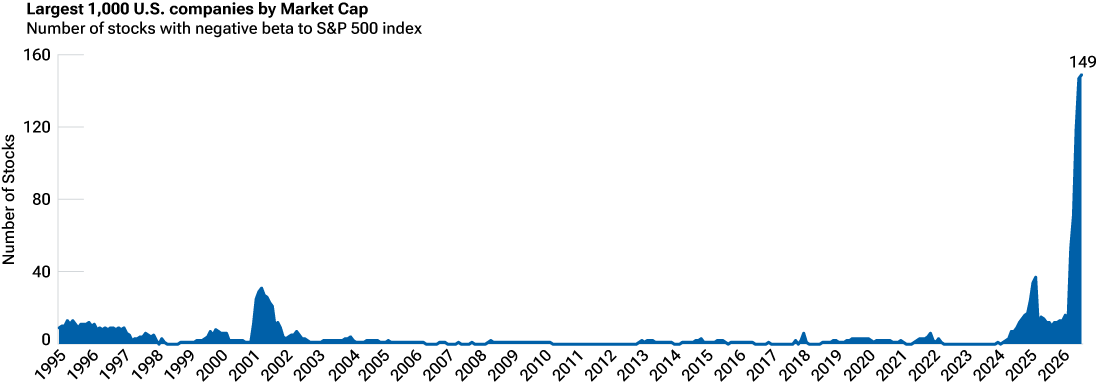
Alongside this extraordinary concentration at the top of the market, there are signs of increasing divergence across the broad market. Among the largest 1,000 U.S. companies, the number of stocks exhibiting negative beta to the S&P 500 has risen sharply, reaching 149 in 2026 (Figure 3). For much of the previous two decades, such stocks were rare. However, a growing cohort of companies now appears to have return drivers that are less connected to the technology‑ and AI‑led themes dominating the index—an unusual evolution with important implications for portfolio construction.

Negative‑beta stocks have reached a record high 

(Fig. 3) There has been a surge in negative‑beta stocks versus the S&P 500 index, highlighting an increasingly dispersed market environment


As of August 31, 2026.
Source: UBS Holt as of August 31, 2026. Beta measured as 1‑year daily returns vs SPX Index returns. Stocks are defined as “negative beta” based on this measure on a daily basis versus the S&P 500 index. Universe of largest 1000 US companies by market cap.

While the fragmentation of a factor universe can create opportunities for active investors, it also raises the stakes. When the factor profile of a group of stocks changes materially, understanding how individual stock decisions interact at the total‑portfolio level becomes increasingly important. A collection of attractive stocks may not make for a well‑diversified portfolio as stock correlations shift. Specifically, factor exposures, beta, and industry concentration can amplify—or overwhelm—any stock‑specific insights an investor intended to capture. At the same time, passive exposure should not be viewed as a risk‑free option or antidote to the concentration equation. As concentration levels rise, it’s natural for the index to increasingly reflect the risk characteristics of any group of companies that has taken on more ownership and potential crowding.

The Integrated Equity investment approach is designed to address many of the complexities that exist in today’s world. By combining T. Rowe Price’s fundamental stock research with quantitative insights and disciplined portfolio construction, the aim is to capture stock‑specific alpha while actively managing portfolio risks to limit undue reliance on any single source of return, regardless of market structure. The approach seeks to preserve the predictability, cost efficiency and adaptability associated with passive exposure, while incorporating stock‑level insights with the objective of generating risk‑controlled alpha across changing market environments.

Laurence Taylor, CFA Equity Solutions Portfolio Manager Andrew W. Tang, CFA, CAIA® Co-Portfolio Manager
Oct 2026 Equity Article

The ChatGPT moment in transportation? Autonomous driving nears commercial inflection

Autonomous driving could be one of the most compelling AI use cases.
By   David R. Giroux, CFA, Michael J. Signore
Oct 2026 Equity Article

Why AI’s next phase could favor investors with a global view

We see potential opportunity in non-U.S. stocks linked to AI adoption and applications.
By   Tedd Alexander, David Corris, CFA, Brian Dausch, CFA

Risks: Active investing may have higher costs than passive investing and may underperform the broad market or passive peers with similar objectives. Diversification cannot assure a profit or protect against loss in a declining market. Fundamental approach: There is risk that an active manager may make a wrong call regarding a particular security or sector. Passive investing may lag the performance of actively managed peers, as holdings are not reallocated based on changes in market conditions or outlooks on specific securities. Quantitative models: Relying on quantitative models and the analysis of specific metrics in constructing a portfolio could cause an investor to be unsuccessful in selecting companies for investment or determining the weighting of particular stocks in the portfolio.

Additional Disclosures

This material is intended to be of general interest only and should not be construed as investment advice or a recommendation to take any particular investment action. Where securities are mentioned, the specific securities identified and described are for informational purposes only and do not represent recommendations or statement of opinion intended to influence a person or persons in making a decision in relation to investment.

Figure 1: The TMT bubble—short for the Technology, Media, and Telecom bubble (widely known as the Dot‑com bubble)—was a historic stock market mania during the late 1990s where speculative investor hype over‑inflated the share prices of internet and tech startups. Long‑Term Capital Management (LTCM) was a prominent American hedge fund founded in 1994 by former Salomon Brothers vice‑chairman John Meriwether, which famously collapsed in 1998.

Visit troweprice.com/glossary for definitions of financial terms.

Please see vendor indices for more information, including definitions and source data: troweprice.com/marketdata.

Important Information

This is intended for investment professional use only. Not for further distribution.

This material is being furnished for informational and/or marketing purposes only and does not constitute an offer, recommendation, advice, or solicitation to sell or buy any security.

Prospective investors should seek independent legal, financial and tax advice before making any investment decision. T. Rowe Price group of companies including T. Rowe Price Associates, Inc. and/or its affiliates receive revenue from T. Rowe Price investment products and services.

Past performance is not a guarantee or a reliable indicator of future results. All investments involve risk, including possible loss of principal.

Information presented has been obtained from sources believed to be reliable, however, we cannot guarantee the accuracy or completeness. The views contained herein are those of the author(s), are as of October 2026, are subject to change, and may differ from the views of other T. Rowe Price Group companies and/or associates. Under no circumstances should the material, in whole or in part, be copied or redistributed without consent from T. Rowe Price.

All charts and tables are shown for illustrative purposes only. Actual future outcomes may differ materially from any estimates or forward‑looking statements provided.

The material is not intended for use by persons in jurisdictions which prohibit or restrict the distribution of the material and in certain countries the material is provided upon specific request.

Australia—Issued by T. Rowe Price Australia Limited (ABN: 13 620 668 895 and AFSL: 503741), Level 28, Governor Phillip Tower, 1 Farrer Place, Sydney NSW 2000, Australia. For Wholesale Clients only. 

Canada—Issued in Canada by T. Rowe Price (Canada), Inc. T. Rowe Price (Canada), Inc.’s investment management services are only available to non‑individual Accredited Investors and non‑individual Permitted Clients as defined under National Instrument 45‑106 and National Instrument 31‑103, respectively. T. Rowe Price (Canada), Inc. enters into written delegation agreements with affiliates to provide investment management services. 

DIFC—Issued in the Dubai International Financial Centre by T. Rowe Price International Ltd which is regulated by the Dubai Financial Services Authority as a Representative Office. For Professional Clients only. 

EEA—This material is issued and approved by T. Rowe Price (Luxembourg) Management S.à r.l. 35 Boulevard du Prince Henri L‑1724 Luxembourg which is authorised and regulated by the Luxembourg Commission de Surveillance du Secteur Financier. For Professional Clients only. 

New Zealand—Issued by T. Rowe Price Australia Limited (ABN: 13 620 668 895 and AFSL: 503741), Level 28, Governor Phillip Tower, 1 Farrer Place, Sydney NSW 2000, Australia. No Interests are offered to the public. Accordingly, the Interests may not, directly or indirectly, be offered, sold or delivered in New Zealand, nor may any offering document or advertisement in relation to any offer of the Interests be distributed in New Zealand, other than in circumstances where there is no contravention of the Financial Markets Conduct Act 2013. 

Switzerland—Issued in Switzerland by T. Rowe Price (Switzerland) GmbH, Talstrasse 65, 6th Floor, 8001 Zurich, Switzerland. For Qualified Investors only. 

UK—This material is issued and approved by T. Rowe Price International Ltd, Warwick Court, 5 Paternoster Square, London EC4M 7DX which is authorised and regulated by the UK Financial Conduct Authority. For Professional Clients only. 

USA—Issued in the USA by T. Rowe Price Associates, Inc., investment adviser, 1307 Point Street, Baltimore, MD 21231, which is regulated by the U.S. Securities and Exchange Commission. For Institutional Investors Only.

Unless otherwise indicated, this material is issued and approved by T. Rowe Price International Ltd, Warwick Court, 5 Paternoster Square, London EC4M 7DX which is authorised and regulated by the UK Financial Conduct Authority. For Professional Clients only.

© 2026 T. Rowe Price. All Rights Reserved. T. Rowe Price, INVEST WITH CONFIDENCE, the Bighorn Sheep design, and related indicators (see troweprice.com/ip) are trademarks of T. Rowe Price Group, Inc. All other trademarks are the property of their respective owners. Use does not imply endorsement, sponsorship, or affiliation of T. Rowe Price with any of the trademark owners.

202609‑5908301

Open

Audience for the document: Share Class: Language of the document:
Open Cancel

Open

Share Class: Language of the document:
Open Cancel
Sign in to manage subscriptions for products, insights and email updates.
Sign in
Once registered, you'll be able to start subscribing.

Change Details

If you need to change your email address please contact us.
Subscriptions
OK
You are ready to start subscribing.
Get started by going to our products or insights section to follow what you're interested in.

Products Insights

GIPS® Information

T. Rowe Price (“TRP”) claims compliance with the Global Investment Performance Standards (GIPS®).

A complete list and description of the Firm's composites and/or a presentation that adheres to the GIPS® standards are available upon request. Additional information regarding the firm's policies and procedures for calculating and reporting performance results is available upon request. 

Other Literature

You have successfully subscribed.

Notify me by email when
regular data and commentary is available
exceptional commentary is available
new articles become available

Thank you for your continued interest