
May 2024 / INVESTMENT INSIGHTS
Global Asset Allocation Viewpoints
Our experts share perspective on market themes and regional trends, plus insights into current portfolio positioning.
Market Perspective
As of 30 April 2024
- Global growth outlook remains positive against a backdrop of gradually easing inflationary pressures across most economies..
- U.S. growth continues to be resilient, buoyed by a strong consumer, while optimism around European growth is building. Japanese growth remains challenged, and in China, there are signs that policy support is helping stabilize the economy, although risks remain.
- U.S. Fed is still looking towards rate cuts this year, but sticky inflation and resiliency in the economy have tempered expectations. Meanwhile, the European Central Bank (ECB) appears closer to easing given progress with inflation. After hiking in March, the Bank of Japan (BoJ) continues to assess further hikes.
- Key risks to global markets include a retrenchment in growth, stubborn inflation, volatility surrounding central banks’ policy divergence, geopolitical tensions, and trajectory of Chinese growth.
Portfolio Positioning
As of 30 April 2024
- We remain modestly overweight equities, supported by resilient economic growth, positive earnings trends, and areas with more reasonable valuations.
- We remain modestly overweight cash relative to bonds. Cash continues to provide attractive yields with Fed rate cuts pushed further out and the yield curve remaining inverted.
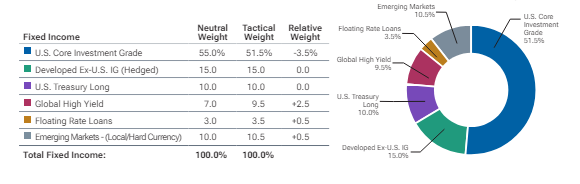
- Within fixed income, we added to U.S. dollar hedged developed market bonds outside of the U.S. given a higher likelihood of interest rate cuts outside the U.S. and an attractive hedged yield for U.S. based investors.
- § Additionally, across fixed income, we remain overweight high yield and emerging markets bonds on still attractive absolute yield levels and reasonably supportive fundamentals.
Market Themes
As of 30 April 2024
Green Shoots?
Economic growth in Europe is showing signs of life after several years of teetering near recessionary levels, with better-than-expected first quarter GDP growth, largely driven by a services-led revival. Muted foreign demand especially from China, fears around a natural gas shortage and decades-high inflation had all weighed on European sentiment in recent years. But the tide appears to be turning on the back of a milder-than-expected winter and falling inflation, increasing the odds for an upcoming rate cut by the ECB in June. This has given way to an uptick in consumer spending and provided a boost to Europe’s tourism and hospitality sectors—notably coming from countries like Spain, Portugal, and Greece. However, it’s Europe’s manufacturing powerhouse, Germany, that continues to struggle given its dependence on exports to China and consequences of having relied on Russian energy, with no quick fix on the horizon. But for now, positive sentiment on the heels of better-than-expected growth, lower inflation, and hopes for near-term rate cuts may draw investors’ attention, but questions remain whether these green shoots will lead to a broader and more sustainable recovery.
Eurozone: All About Services as Manufacturing Lags
As of 30 April 2024
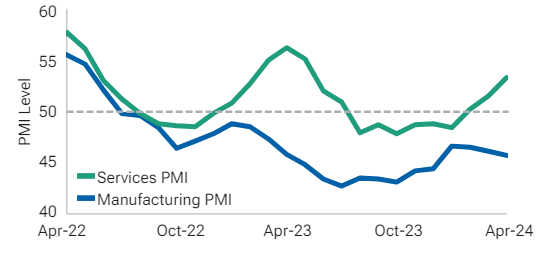
Source: Bloomberg Finance L.P.
The Almighty Dollar
Despite multiple calls for the end of the U.S. dollar’s dominance over recent years, it remains near all-time highs and has strengthened against every major currency in the world so far this year. Its most recent push higher has stemmed from resilient growth in the U.S. sustained in part by elevated fiscal spending along with sticky inflation, causing a shift to less aggressive Fed rate cut expectations. Meanwhile, many other countries have seen a faster decline in inflation, which has put downward pressure on their currencies versus the dollar on expectations their central banks move sooner on rate cuts. The strong dollar has many countries seeing their currencies falling to multi-decade relative lows, with talk of intervention, like in the case of Japan struggling with a slumping Yen. While a weaker currency has aided many of these countries’ exporters, it comes with other consequences including capital competition versus higher yielding markets such as the U.S., import inflation and raising dollar-denominated borrowing costs for countries that are funding in U.S. dollars. With the Fed expected to move slower on rate cuts, U.S. growth remaining resilient, a packed election calendar and still unsettled geopolitical environment, it’s hard to see what breaks the buck, before it may break something else.
U.S. Dollar: Holding Its Strength1
As of 30 April 2024
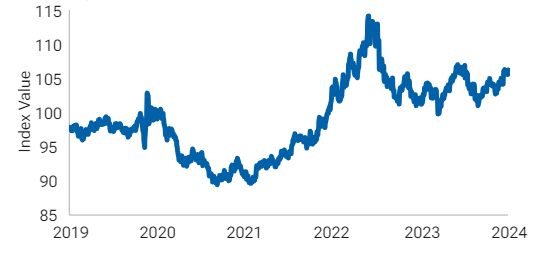
1 Data is represented by the U.S. Dollar Index (DXY).
Regional Backdrop
As of 30 April 2024
| Views | Positives | Negatives | |
|---|---|---|---|
| United States | N |
|
|
| Canada | N |
|
|
| Europe | U |
|
|
| United Kingdom | N |
|
|
| Japan | O |
|
|
| Australia | U |
|
|
| Emerging Markets | O |
|
|
O = Overweight
N = Neutral
U = Underweight
Views are informed by the Asset Allocation Committee and Regional Investment Committees (United Kingdom, Europe, Australia, Japan and Asia) and reflect the equity market.
Asset Allocation Committee Positioning
As of 30 April 2024
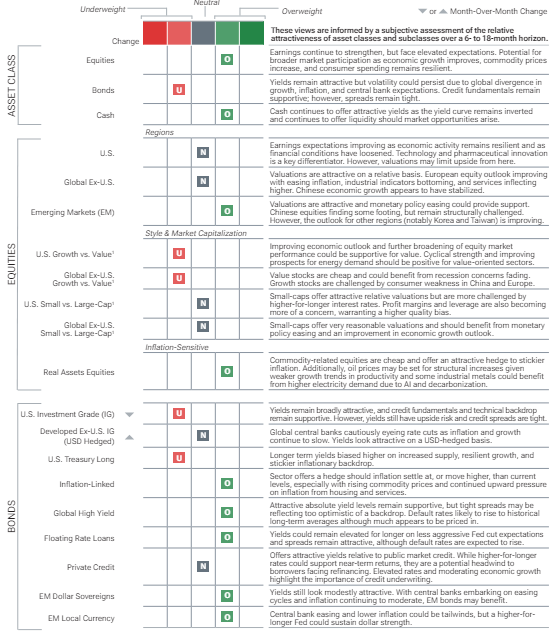
1 For pairwise decisions in style & market capitalization, positioning within boxes represent positioning in the first mentioned asset class relative to the second asset class.
The asset classes across the equity and fixed income markets shown are represented in our Multi-Asset portfolios. Certain style & market capitalization asset classes are represented as pairwise decisions as part of our tactical asset allocation framework.
Portfolio Implementation
As of 30 April 2024
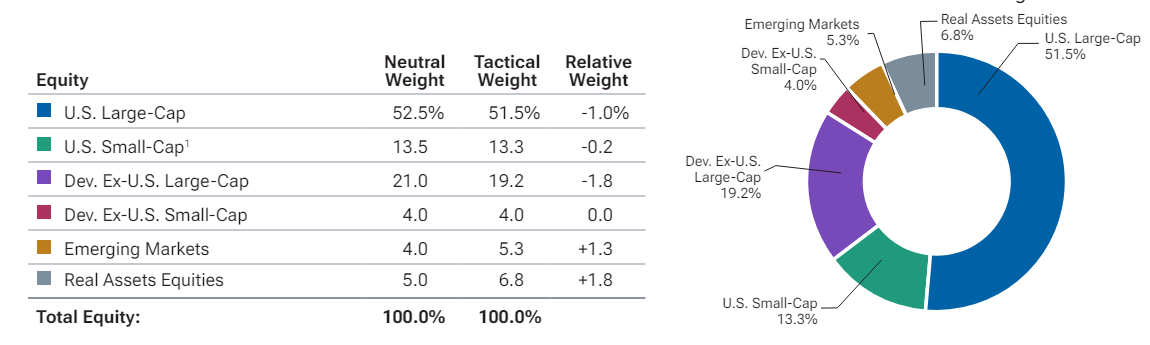
1 U.S. small-cap includes both small- and mid-cap allocations.
Source: T. Rowe Price. Unless otherwise stated, all market data are sourced from FactSet. Copyright 2024 FactSet. All Rights Reserved.
These are subject to change without further notice. Figures may not total due to rounding.Neutral equity portfolio weights representative of a U.S.-biased portfolio with a 70% U.S. and 30% international allocation; includes allocation to real assets equities. Core fixed income allocation representative of U.S.-biased portfolio with 55% allocation to U.S. investment grade.
IMPORTANT INFORMATION
This material is being furnished for general informational purposes only. The material does not constitute or undertake to give advice of any nature, including fiduciary investment advice, and prospective investors are recommended to seek independent legal, financial and tax advice before making any investment decision. T. Rowe Price group of companies including T. Rowe Price Associates, Inc. and/or its affiliates receive revenue from T. Rowe Price investment products and services. Past performance is not a reliable indicator of future performance. The value of an investment and any income from it can go down as well as up. Investors may get back less than the amount invested.
The material does not constitute a distribution, an offer, an invitation, a personal or general recommendation or solicitation to sell or buy any securities in any jurisdiction or to conduct any particular investment activity. The material has not been reviewed by any regulatory authority in any jurisdiction.
Information and opinions presented have been obtained or derived from sources believed to be reliable and current; however, we cannot guarantee the sources' accuracy or completeness. There is no guarantee that any forecasts made will come to pass. The views contained herein are as of the date noted on the material and are subject to change without notice; these views may differ from those of other T. Rowe Price group companies and/or associates. Under no circumstances should the material, in whole or in part, be copied or redistributed without consent from T. Rowe Price.
The material is not intended for use by persons in jurisdictions which prohibit or restrict the distribution of the material and in certain countries the material is provided upon specific request.
It is not intended for distribution to retail investors in any jurisdiction.
USA—Issued in the USA by T. Rowe Price Associates, Inc., 100 East Pratt Street, Baltimore, MD, 21202, which is regulated by the U.S. Securities and Exchange Commission. For Institutional Investors only.
© 2024 T. Rowe Price. All rights reserved. T. ROWE PRICE, INVEST WITH CONFIDENCE, and the bighorn sheep design are, collectively and/or apart, trademarks or registered trademarks of T. Rowe Price Group, Inc.
