Funds
Our wide selection of mutual funds and ETFs provides you with the building blocks for a diversified portfolio.
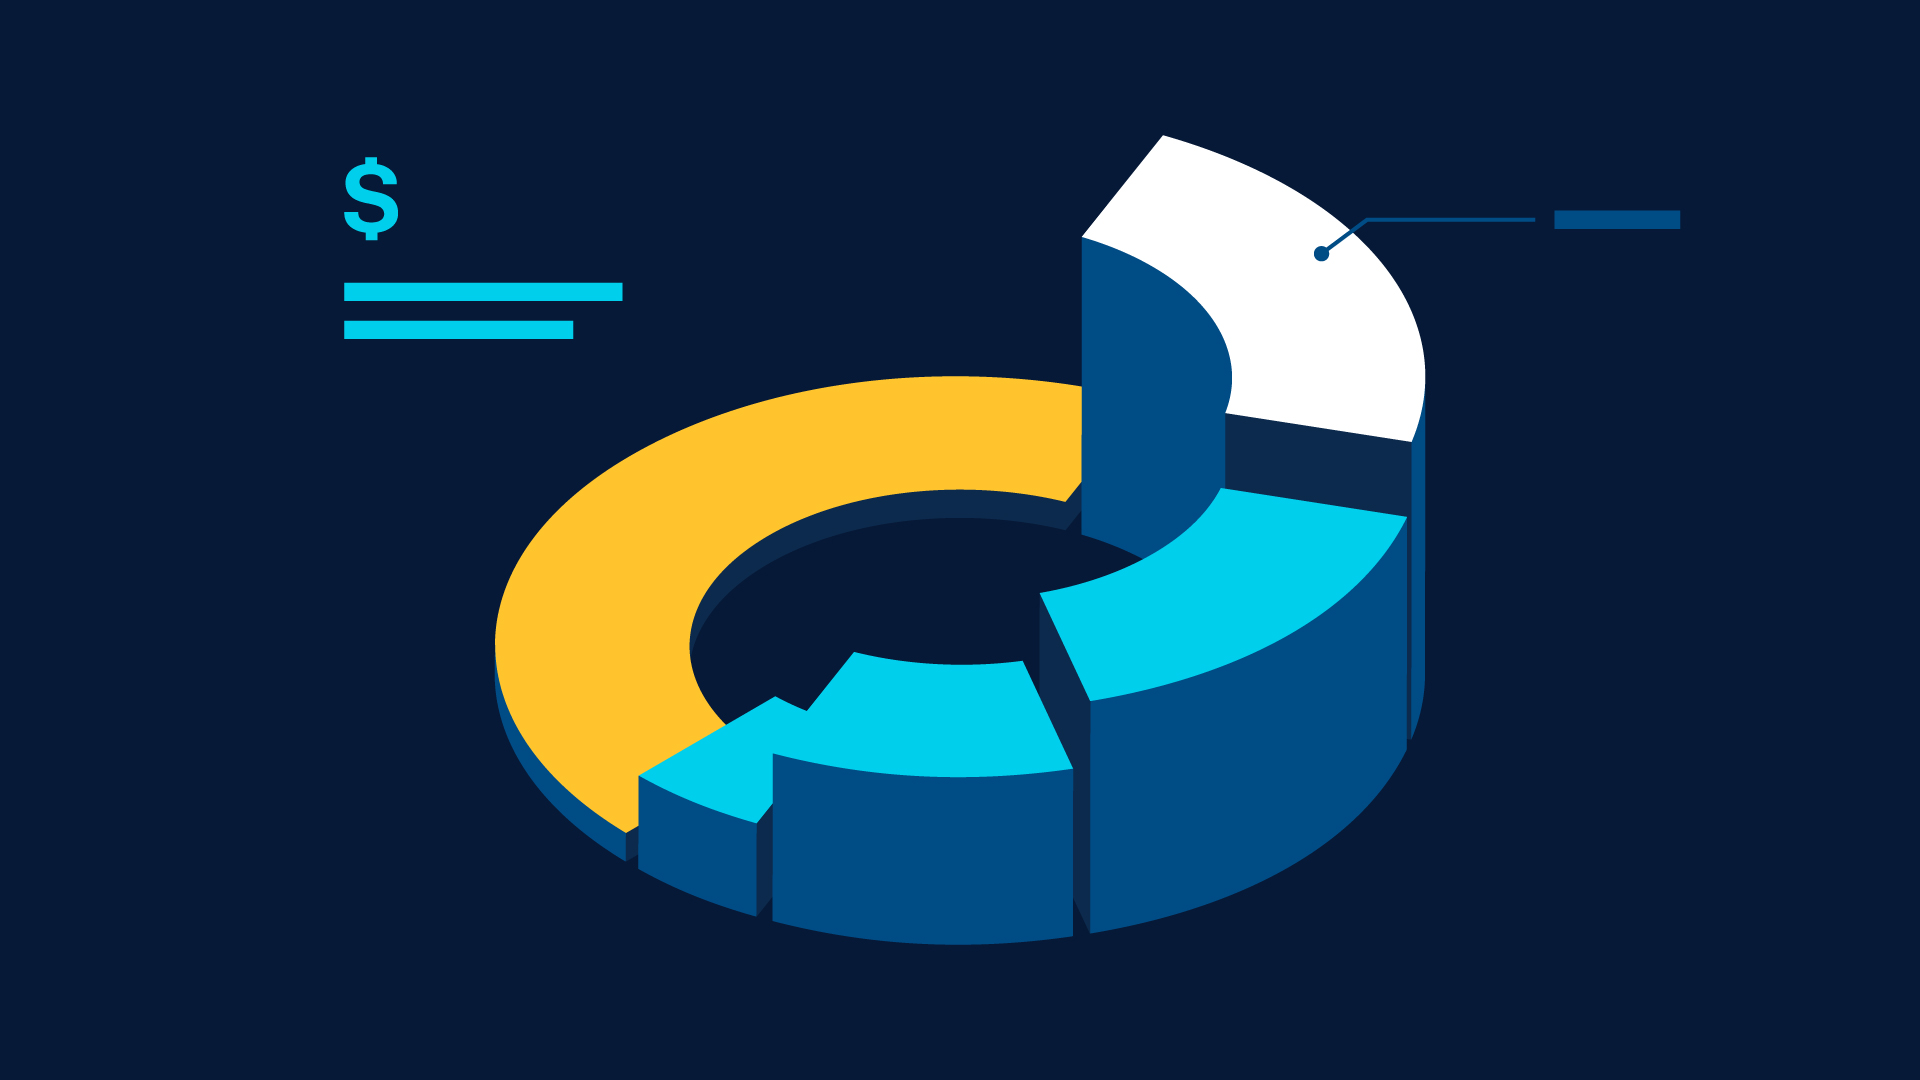
More than 100 mutual funds and ETFs to help you achieve your goals
- Choose from a diverse range of mutual funds and exchange-traded funds (ETFs) across multiple asset classes, capitalizations, sectors, and styles.
- Keep more of what you earn with our low-cost approach, with low expense ratios, no loads, no sales charges, and no commissions on online ETF trades.
Not sure where to start?
Our Financial Consultants can answer your questions and help guide you through selecting a fund.
Get to know our different types of funds

T. Rowe Price Exchange-Traded Funds (ETFs)
A new way to access the expert portfolio managers and strategies behind our mutual funds. Our active ETFs combine the flexibility and control of typical ETF investing with the additional edge that our strategic investing approach can deliver.

T. Rowe Price Mutual Funds
Think of mutual funds as a basket of investments. Its convenient package means you don’t have to buy and manage each security individually. Our professionals research, select, and monitor each fund’s investments for you, based on specific strategies and goals.
How are active ETFs and active mutual funds different?
Active ETFs can be traded throughout the day and usually update their holdings daily, while active mutual funds only trade at the end of the day and typically share their holdings monthly.
| Key Features | ETF | Mutual fund |
|---|---|---|
| Intraday pricing | Yes | No |
| Intraday trading | Yes | No |
| Automatic transactions | No
|
Yes
|
| Minimum investment | No
|
Yes
|
| Control over capital gains | Yes
|
No
|
For additional information regarding the unique attributes and risks, see the prospectus.
Enhance your fund-picking confidence
T. Rowe Price® Select Funds
Narrow your fund choices. We screen our lineup of mutual funds down to a simple list of diverse options to help you select your investments more easily.
Watchlists
Track and monitor specific investments with your Watchlist. Easily keep an eye on performance, pricechanges, and detailed historical data that help you make investment choices when you're ready.
Invest for your short- and long-term goals
Start investing today
Help make the most of your money.
Need help finding the right account?
Our Financial Consultants can help you find the right solution for your goals.
Monday—Friday, 8 a.m.—8 p.m. ET
Explore investment options
Browse funds, compare funds, and create your own watch lists.
Important Information
There is no guarantee any ETF will outperform its benchmarks.
ETFs are bought and sold at market prices, not NAV. Investors generally incur the cost of the spread between the prices at which shares are bought and sold. Buying and selling shares may result in brokerage commissions which will reduce returns.
Risk Considerations: All investments are subject to risk, including the possible loss of principal. Active investing may have higher costs than passive investing and may underperform the broad market or passive peers with similar objectives. Passive investing may lag the performance of actively managed peers as holdings are not reallocated based on changes in market conditions or outlooks on specific securities.
4858014