
June 2023 / RETIREMENT INSIGHTS
SECURE 2.0 Could Boost the Financial Wellness Landscape
Optional provisions in new law could help improve retirement outcomes.
Key Insights
- Multiple small loans from retirement plan accounts, hardship withdrawals, and student loan debt all correlate with lower retirement contributions.
- Optional provisions in SECURE 2.0 could reshape workplace financial well‑being programs and allow sponsors to tailor plans for their participants.
- Whether offered in plan or out of plan, access to financial wellness programs could help improve retirement outcomes.
We think of financial wellness as the level of comfort with one’s current financial situation and confidence in future financial outcomes. For many workers, the challenges of balancing day‑to‑day household finances while also juggling competing financial goals—such as repaying student loans, starting a family, purchasing a home, or saving for a child’s education, among others—often persist throughout their working years.
Plan sponsors, retirement industry professionals, and lawmakers are paying close attention as employees continue to express a need for comprehensive financial wellness programs. These solutions are proving to be critical solutions for helping workers meet their goals. Our research shows that the workplace remains the primary source for accessing educational tools and financial guidance and that most employees value programs that can help them with emergency savings, financial education, and debt (Figure 1).
Employees Continue to Demand Financial Wellness Solutions
(Fig. 1) Participant interest in guidance across age and race
| All | Gen Z | Millennials | Gen X | Baby Boomers + Silent* | White† | Black† | Hispanic | Asian | Other | |
|---|---|---|---|---|---|---|---|---|---|---|
| Building emergency savings | 73% | 79% | 78% | 73% | 61% | 69% | 81% | 80% | 74% | 86% |
| Basic financial education, covering topics such as budgeting and debt management | 61 | 74 | 67 | 60 | 44 | 55 | 71 | 72 | 67 | 71 |
| Online budgeting tools and financial calculators | 56 | 71 | 63 | 56 | 38 | 51 | 65 | 67 | 61 | 60 |
| Student loan repayment | 31 | 49 | 43 | 29 | 8 | 28 | 41 | 36 | 26 | 41 |
*Includes baby boomers born in the years 1946 to 1964 and the silent generation born in the years 1925 to 1945.
† Non‑Hispanic.
Source: T. Rowe Price Retirement Savings and Spending Study, 2022. See end disclosures for additional important information on the study.
A deep analysis of plan data can unmask distortions in overall averages and help identify vulnerable populations across age, race, and gender who are disproportionately impacted by financial stressors and who could potentially benefit significantly from targeted financial wellness solutions, if available. We are also witnessing changes in the relationships between employers and employees. In particular, young employees entering the workforce today have different expectations of their employers and the benefits offered to them than did previous generations. Traditional recruitment efforts have focused on compensation and job advancement opportunities; however, in addition to workplace flexibility and the desire for meaningful work, younger employees value employers who care about them and their well‑being, including their financial wellness.
In an environment where competition for talent remains fierce, financial wellness programs can be a differentiator. Employers should consider how these supportive programs can help them play an important role in the financial lives of their employees, not only as perks for young employees, but as elements of their diversity, equity, and inclusion strategies to help attract and retain diverse talent.
In this paper, we will examine the primary sources of financial stress for many individuals—specifically, the lack of emergency savings and the burden of student loan debt—and how these stressors can impact retirement savings. We will also outline some optional provisions in the recently passed retirement legislation—the SECURE 2.0 Act of 2022 (SECURE 2.0)—that, if applicable, could help employers improve the financial well‑being of their plan population and help them advance their retirement goals.
What Are Plan Participants Struggling With?
Many plan participants are not saving the suggested 15% of their pay for retirement. Among the respondents in our 2022 T. Rowe Price Retirement Savings and Spending Study—which surveyed a nationally representative group of 401(k) plan participants—55% stated that they are not saving enough for retirement or are not sure if they are. Of these participants, 62% indicated that they were saving all that they could afford.1
In our analysis, we examined how loans, hardship withdrawals, and student loan debt can hamper successful retirement outcomes in the long term. We believe financial wellness solutions that can help to address these underlying challenges are critical so that employees can focus on long‑term financial goals, including saving for retirement.
Lack of Emergency Savings
Life is full of surprises, some of which can be quite expensive. Unexpected illness, home repairs, vehicle breakdowns, etc., can cost thousands of dollars. According to a recent Bankrate survey, 57% of Americans couldn’t afford to pay for a $1,000 emergency expense.2
Of the participants we surveyed, 91% said that having enough savings for an emergency was a major or minor financial goal. Households making less than $50,000, in particular, had the greatest interest in receiving help to build emergency savings funds. Although most workers understand the importance of having an emergency fund, almost one‑quarter of our respondents reported making little or practically no progress toward meeting that goal.
Emergency savings programs can help savers absorb financial shocks without sacrificing their retirement security.
Loan Activity, Dipping Into Retirement Plan Account Balances
The inability to cover life’s sudden, and often unforeseen, costs can damage an employee’s chances for a comfortable retirement. Among our survey respondents, 14% of participants stated that they were likely to tap into their workplace retirement accounts to cover unexpected expenses. For these participants, relying on retirement savings to cover emergency expenses could develop into an ongoing pattern where they repeatedly take retirement plan loans to address their short‑term needs, as the data seem to indicate.
Unlike common assumptions, loan activity is not a generational issue that is limited to younger participants. Unless workers address the real underlying problem—lack of emergency savings—this cycle is likely to continue throughout their working lives. In fact, a review of loan behavior among the more than 2 million plan participants in T. Rowe Price’s recordkeeping database found an uptick in loan activity as participants age through their working years (Figure 2).
Loan Activity Tends to Increase as Participants Age Through Their Working Years
(Fig. 2) Share of different age groups in loan activity
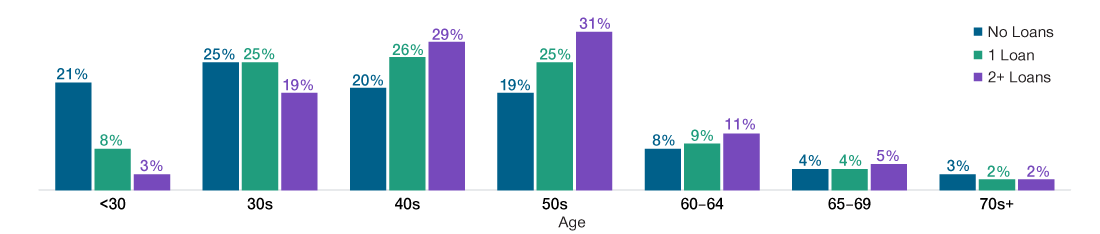
As of December 31, 2022.
Source: T. Rowe Price recordkeeping platform. Data represent participant behavior 2018–2022.
An analysis of plan‑specific data could help identify where truly problematic behavior exists, as plan sponsors evaluate the potential value of emergency savings provisions in SECURE 2.0.
Our recordkeeping data showed that participants who took loans had lower deferral rates, on average, than participants who rarely, or never, borrowed from their retirement plan accounts. In particular, our analysis found that the deferral rate for participants who took multiple loans per year was lower, on average, by 2.3 percentage points.
We acknowledge that retirement plan loans are not inherently an indicator of poor financial health. Data show that, if retirement plan loans are taken strategically, participants can minimize the long‑term impact on their retirement outcomes. Indeed, the deferral rates for participants who took one large loan were in line with participants who did not take retirement plan loans (Figure 3).
Plan Loans Are Associated With Lower Deferral Rates
(Fig. 3) Deferral rates by number of loans taken per year and average dollar amount
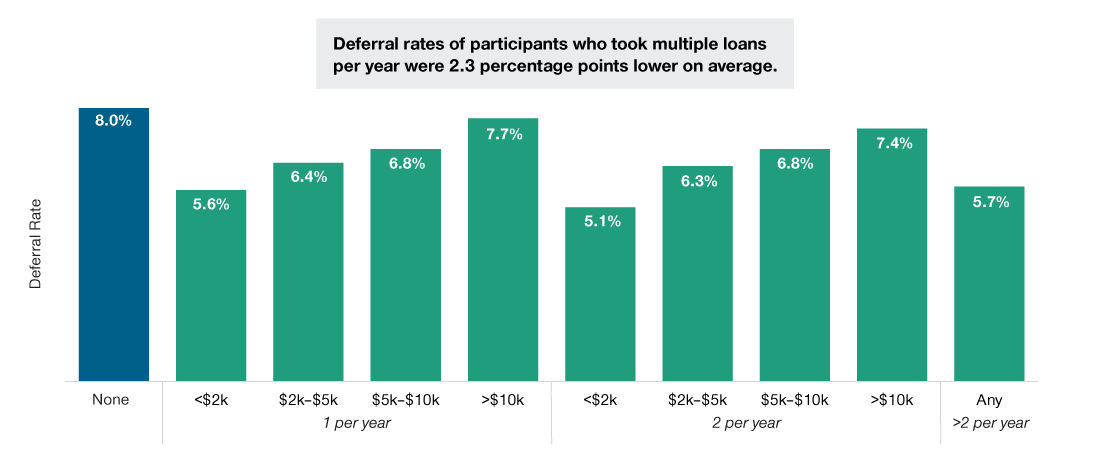
As of December 31, 2022.
Source: T. Rowe Price recordkeeping platform. Data represent participant behavior 2018–2022.
However, a focus on smaller loans is more telling. The average deferral rate for participants who took multiple small loans (less than $2,000) per year was meaningfully lower. The frequency of these small loans can be a sign of financial stress as participants may be using their retirement savings to supplement their incomes. These participants could benefit from a plan design and tools that make it easier to build up emergency savings.
Relatedly, not only did participants who took retirement plan loans save less than their peers who did not take loans, but they also had lower average plan account balances (Figure 4). Remarkably, despite a consistent average age and job tenure, account balances for participants who took an average of more than two loans per year were 60% smaller than for participants with no loans.
Multiple Loans Can Be a Warning Sign of Financial Stress
(Fig. 4) Loan impact on retirement plan account balances and deferral rates
| No Loans | One Loan Per Year | Two Loan Per Year | More Than Two Loans Per Year | |
|---|---|---|---|---|
| Average Age | 45 | 42.7 | 43 | 43.9 |
| Average Balance ($) | 105k | 53k | 44k | 42k |
| Average Deferral Rate | 8.1% | 6.5% | 6.2% | 5.5% |
| Average Tenure | 8 | 10 | 9 | 11 |
As of December 31, 2022.
Source: T. Rowe Price recordkeeping platform. Data represent participant behavior 2018–2022.
Our recordkeeping data further revealed that 10% of participants who took two or more loans also had taken hardship withdrawals. These participants had an average account balance of $26,000, about one‑quarter of the account balance of their peers with no loans.
This vulnerable population is lagging. Persistent retirement plan loans, lower deferral rates, and lower account balances all could be indications that these savers are struggling to manage their day‑to‑day household finances, including maintaining a budget or paying down debt. These signs of financial stress—undersaving and untimely withdrawals—also are detrimental to successful retirement outcomes.
Hardship Withdrawals Also Indicate Financial Struggle
For plans that offer hardship withdrawals, it is not surprising that, as with loan activity, participants who have taken hardship withdrawals tend to have lower average retirement account balances and deferral rates than participants who have not taken those distributions (Figure 5). The long‑term compounded effect of taking hardship withdrawals can result in dramatically lower account balances for these participants.
A Generational Look at the Impact of Hardship Withdrawals
(Fig. 5) Hardship withdrawals resulted in lower retirement plan account balances and deferral rates
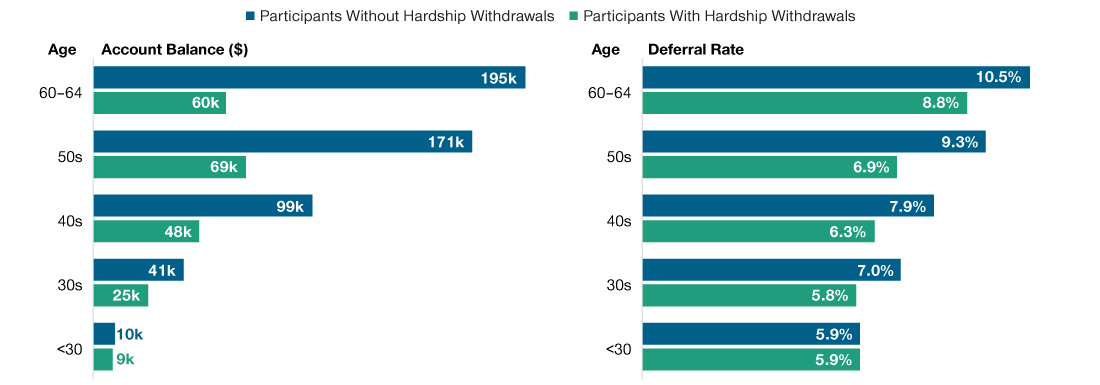
As of December 31, 2022.
Source: T. Rowe Price recordkeeping platform. Data represent participant behavior 2018–2022.
Indeed, our study found that participants who were nearing retirement and had not taken a hardship distribution had, on average, an account balance that was three times more than their counterparts who had taken hardship withdrawals.
Building Emergency Savings, How Can Employers Help?
The workplace remains an important source of advice for retirement savers. This creates a great opportunity for plan sponsors and recordkeepers to engage with participants and provide guidance that can help them improve their financial wellness and overcome potential barriers to successful retirement outcomes.
SECURE 2.0 includes optional provisions that employers can implement to help their employees with emergency savings. An emergency fund—whether inside or outside the base retirement plan—would help savers to cover unexpected expenses without incurring additional debt, taking retirement plan loans, or withdrawing from plan balances and incurring penalties.
For plan sponsors considering an in‑plan emergency fund option, SECURE 2.0 provides two paths that take effect in 2024.
- Emergency withdrawals: In general, participants would be allowed no more than one penalty‑free emergency withdrawal of up to $1,000 per year. Following an emergency withdrawal, no more emergency withdrawals may be taken for the next three calendar years unless the distribution has been repaid to the plan or the participant has subsequently made contributions to the plan at least equal to the amount of the prior withdrawal that has not been repaid.
- Pension‑linked emergency savings (PLESA): Plan sponsors will be able to create a separate account for each participant within the plan for emergency savings, where individuals other than highly compensated employees could contribute up to $2,500 (indexed). This amount would have to be contributed on a Roth basis and invested in a short‑term investment vehicle, such as a money market fund.3 Funds can then be withdrawn from the account penalty‑free and as often as once per month.
While the withdrawal option would be straightforward and could be easier to implement and administer, plan sponsors should also consider the following:
- Separate emergency savings accounts would provide larger cushions for employees but would also require additional recordkeeping infrastructure.
- Special distribution rules would apply to emergency savings accounts if and when participants terminate employment.
To help plan sponsors evaluate whether an in‑plan or out‑of‑plan solution would be best for their participant needs, we have outlined some advantages and drawbacks for consideration in Figure 6.
Considerations for Implementing an Emergency Savings Program
(Fig. 6) Pros and cons of an in‑plan versus an out‑of‑plan solution
| Solutions | Advantages | Drawbacks |
|---|---|---|
| In Plan | Participants don’t have to take additional steps to set up or activate their benefits. | New distribution rights could be considered protected benefits that cannot be removed or amended in the future. |
| The PLESA provision allows sponsors to match emergency savings inside the plan. This could boost savings and provide a tax advantage for the employer. | Options offered within the plan would be administered under ERISA and/or Internal Revenue Code guidelines, which could result in additional administrative burden and potential costs associated with compliance and support. | |
| Employers who adopt the PLESA provision can automatically enroll participants for the emergency savings benefit. Participants can be nudged to redirect contributions to their regular retirement accounts once emergency savings reach a certain threshold. | ||
| Out of Plan | Employee contributions to emergency funds are not subject to specific limits, although employers could impose paycheck limits (if facilitated by payroll contributions). | Usually requires involvement of a third party since savings typically are deposited in a banking product. |
| Benefits are not subject to ERISA or Internal Revenue Code regulations; removes potential ERISA fiduciary responsibility from employer. | Requires active employee engagement, which could limit adoption. Our research suggests that most retirement savers are hands‑off and prefer automated features. | |
| Offers more flexibility to employees in access to funds and withdrawal options. |
SECURE 2.0 also recognizes that financial realities can drive the need to tap into retirement assets. The new law includes a host of provisions that also could help plans to serve as financial safety valves for their participants. These provisions allow a number of new penalty‑free distributions, including:
- Formal relief to fund recovery from disasters, effective immediately
- Distributions of any amount for terminally ill individuals,4 effective immediately
- Increased hardship withdrawal availability for 403(b) participants, effective in 2024
- Distributions for victims of domestic violence, effective in 2024
Student Loan Debt
In addition to a lack of emergency savings, the burden of student loans is another potential barrier to retirement savings. Americans owe more than $1.6 trillion in government‑issued or government‑insured student loan debt, of which 24% was in either forbearance or default.5 For many workers, repaying student loan debt is a significant competing priority to saving for retirement. Among the participants we surveyed, roughly 1 in 4 reported that they had outstanding college debt.6
Student Loans Correlate with Lower Retirement Contributions
Our analysis also revealed that younger participants—who tend to earn lower wages than older workers—were more likely to have outstanding student loans (Figure 6). While retirement plan participation was on par across employees with or without college debt, participants with student loan debt had lower average deferral rates than those without student loans across all age groups.
Participants With Student Loans Saved Less
(Fig. 7) Percentage of participants with and without college debt and average deferrals across age groups
| All | Gen Z | Millennials | Gen X | Baby Boomers | |
|---|---|---|---|---|---|
| No Student Loan | 76% | 60% | 65% | 80% | 90% |
| Outstanding Student Loan | 24% | 40% | 35% | 20% | 10% |
| Average Deferral Rates (% of Salary) | |||||
|---|---|---|---|---|---|
| All | Gen Z | Millennials | Gen X | Baby Boomers | |
| Student Loan | 7.2 | 6.3 | 7.2 | 7.2 | 8.7 |
| No Student Loan | 9.0 | 9.2 | 9.1 | 8.9 | 9.2 |
As of December 31, 2022.
Source: T. Rowe Price recordkeeping platform. Data represent participant behavior 2018–2022.
The difference in deferral rates was more pronounced among Generation Z participants. In that age group, those with student loans contributed over 30% less to their retirement plan savings compared with their peers without loans. In addition, studies have shown that members of some racial or ethnic groups are more likely to have larger student loan debt balances on average than others. As outlined in Figure 1, the share of Black and Latinx participants who expressed an interest in student loan repayment programs was significantly higher than white participants.
The student loan match provision in SECURE 2.0 could, therefore, be pivotal in improving retirement outcomes for an employer with a large population of workers with college debt.
Boosting Retirement Savings
SECURE 2.0 not only addresses barriers to retirement savings, but it also includes provisions intended to boost savings, such as the Saver’s Match and changes in the rules for catch‑up contributions.
For plans with a significant portion of lower‑wage workers, the Saver’s Match provision is an innovative new program designed to improve upon the existing Saver’s Credit and adds a federally funded match that can boost retirement savings for low‑income workers. Starting in 2027, employees earning less than specified amounts will be eligible to receive the match in an IRA or plan that has agreed to accept such amounts.
Starting in 2025, changes to catch‑up contributions will allow participants between the ages of 60 and 63 to make higher catch‑up contributions (the greater of $10,000 or 50% more than the regular catch‑up amount, indexed to inflation).
SECURE 2.0 and Student Loan Matching Contributions
Postponing retirement saving in order to pay off student loans can be costly. Data show that starting to save early and then saving consistently can make a big difference in helping workers retire on their own terms. A dollar saved at age 40 or later doesn’t have the same time to compound as a dollar saved earlier in life. When saving for retirement, slow and steady typically wins the race.
According to the Employee Benefit Research Institute (EBRI), 25% of employers with 500 or more employees offered student loan debt assistance in 2022, an increase from 17% in 2021.7 This benefit is markedly increasing in popularity, and this number is likely to keep rising amid competition for talent and as employees, weighed down by college debt, continue to express a need for these programs.
Before the passage of SECURE 2.0, employers could offer student loan repayment assistance through:
- Lump‑sum sign‑on bonus at the start of employment
- Recurring direct payments to student loan lenders
- Service‑based assistance that can be paid annually or in a lump sum upon eligibility
- Employer retirement contributions
- A trade of unused vacation time for student loan payments
Beginning in 2024, plan sponsors will be able to provide in‑plan matching contributions upon receipt of annual certifications from participants showing that they have made payments on student loans for qualified higher education expenses. The amount of student loan repayments eligible for the match cannot be greater than the standard annual deferral limit, reduced by any deferrals the participant made to the plan in that plan year. (At the writing of this paper, requirements regarding the timing for allocating matching contributions and claiming the student loan match benefit remain unclear.)
Student loan repayment programs, whether in or out of plan, can allow employees to focus on both college debt reduction and long‑term retirement saving goals. However, employers who adopt the student loan match provisions in SECURE 2.0 can have a direct impact on retirement savings. This benefit could be an important tool for sponsors who prefer not to support student loan repayment through direct payments to employees.
Considerations for Implementing a Student Loan Assistance Program
(Fig. 8) Pros and cons of an in‑plan versus an out‑of‑plan solution
| Solutions | Advantages | Drawbacks |
|---|---|---|
| In Plan | Matching contributions are earmarked for retirement savings, which can boost retirement outcomes for participants. | Options offered within the plan would be administered under Internal Revenue Code guidelines, which could result in additional administrative burden and potential costs associated with compliance and support. |
| Employers receive a tax benefit for student loan matching contributions. | ||
| Out of Plan | Employers have the flexibility to choose which benefit option would be best received by its participant population. | Usually have service‑based requirements, and lengthy commitments could be a deterrent to some talent pools. |
| Benefits are not subject to Internal Revenue Code regulations. | The $5,250 tax‑exempt student loan repayment provision under the CARES Act is expected to end in 2025. |
For employers interested in the student loan match provision, some considerations are outlined in Figure 8.
Final Thoughts
Managing day‑to‑day living expenses and debt are often cited by participants as being the top sources of financial stress, as well as the main barriers to saving for retirement. Financial wellness programs can help employees manage their financial well‑being and help improve their retirement outcomes.
One size doesn’t fit all, and plan sponsors should consider their resources and the needs of their employees when selecting the path they believe will best serve their participants. The good news is that innovative technology continues to improve user experience for services that now can be delivered seamlessly to plan sponsors and participants.
Whether accessed in or out of plan, financial wellness programs have the potential to enhance retirement outcomes. Further, in a tight labor market, employers can leverage such benefit offerings—with their retirement plan as a key component—to help attract and retain talent.
Retirement Savings and Spending Study
The Retirement Savings and Spending Study is a nationally representative online survey of 401(k) plan participants and retirees. The survey has been fielded annually since 2014. The 2022 survey was conducted between June 24 and July 22. It included 3,895 401(k) participants, full‑time or part‑time workers who never retired, currently age 18 or older, and either contributing to a 401(k) plan or eligible to contribute and have a balance of $1,000+. The survey also included 1,136 retirees who have retired with a Rollover IRA or left‑in‑plan 401(k) balance. NMG Consulting conducts this annual survey on behalf of T. Rowe Price.
This research is a continuation of the second theme of Financial Wellness that is discussed in our 2023 Retirement Market Outlook. This theme focuses on the need for more holistic and comprehensive services that take a broader view of retirement, wealth, and health needs throughout an individual’s working years into retirement. For more details, our Retirement Market Outlook can be accessed here: troweprice.com/retirementoutlook
IMPORTANT INFORMATION
This material is being furnished for general informational purposes only. The material does not constitute or undertake to give advice of any nature, including fiduciary investment advice, and prospective investors are recommended to seek independent legal, financial and tax advice before making any investment decision. T. Rowe Price group of companies including T. Rowe Price Associates, Inc. and/or its affiliates receive revenue from T. Rowe Price investment products and services. Past performance is not a reliable indicator of future performance. The value of an investment and any income from it can go down as well as up. Investors may get back less than the amount invested.
The material does not constitute a distribution, an offer, an invitation, a personal or general recommendation or solicitation to sell or buy any securities in any jurisdiction or to conduct any particular investment activity. The material has not been reviewed by any regulatory authority in any jurisdiction.
Information and opinions presented have been obtained or derived from sources believed to be reliable and current; however, we cannot guarantee the sources' accuracy or completeness. There is no guarantee that any forecasts made will come to pass. The views contained herein are as of the date noted on the material and are subject to change without notice; these views may differ from those of other T. Rowe Price group companies and/or associates. Under no circumstances should the material, in whole or in part, be copied or redistributed without consent from T. Rowe Price.
The material is not intended for use by persons in jurisdictions which prohibit or restrict the distribution of the material and in certain countries the material is provided upon specific request.
It is not intended for distribution to retail investors in any jurisdiction.
USA—Issued in the USA by T. Rowe Price Associates, Inc., 100 East Pratt Street, Baltimore, MD, 21202, which is regulated by the U.S. Securities and Exchange Commission. For Institutional Investors only.
© 2023 T. Rowe Price. All rights reserved. T. ROWE PRICE, INVEST WITH CONFIDENCE, and the bighorn sheep design are, collectively and/or apart, trademarks or registered trademarks of T. Rowe Price Group, Inc.

Sudipto Banerjee is the director of Retirement Thought Leadership in the Investment Product and Retirement Content Group. He is a vice president of T. Rowe Price Associates, Inc.

Rachel Weker is the head of Retirement Plan Services Marketing and Client Experience and is a member of the senior leadership team. Rachel serves as a senior retirement strategist. She is responsible for delivering thought leadership to reinforce the firm’s position in the retirement arena and applying those insights into the development of client experiences. She is a vice president of T. Rowe Price Retirement Plan Services, Inc.
