
January 2023 / INVESTMENT INSIGHTS
The Case for a Dedicated China Allocation within EM
In China, change is the only constant.
In China, change is the only constant. The pace of economic development that the country has experienced over the past few decades is unprecedented. This economic transformation has been matched in the stock market where the universe has grown exponentially and new, disruptive businesses continue to appear.
Yet despite now having the second largest economy and the second largest stock market, we believe China is a market that is often overlooked, or dismissed, by international investors. Short-term newsflow may be overwhelming at times and may distract investors from the longer term view.
Below we set out some arguments as to why having a dedicated China allocation in an emerging market (EM) equity portfolio should be considered.
1. China Is Underrepresented in Global Indices
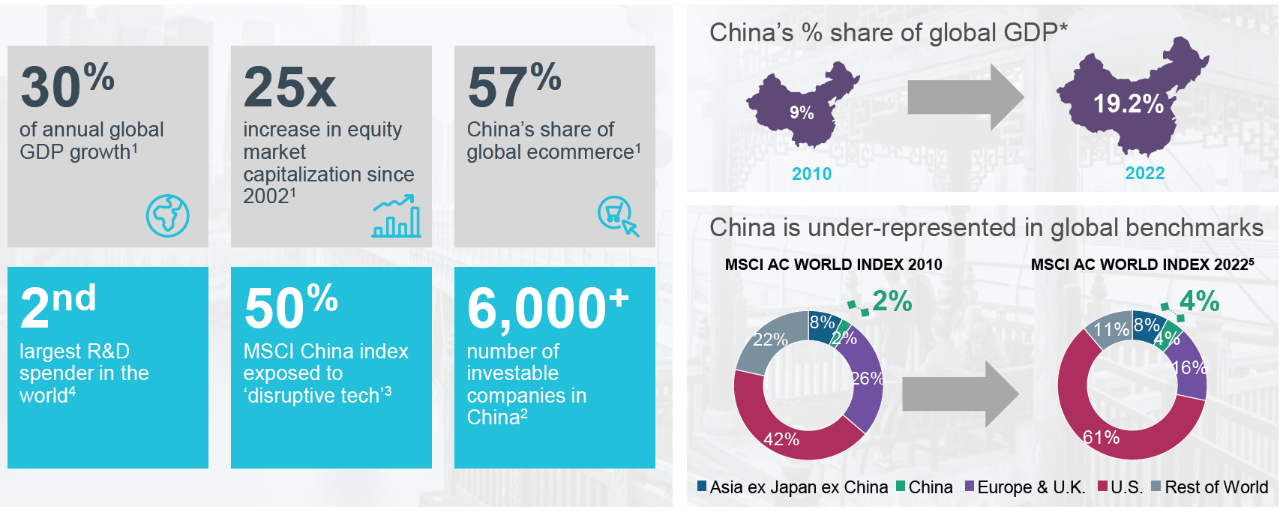
The weight of China in equity indices such as those provided by MSCI is disproportionally small relative to the size of its economy and equity markets. Over the past decade, China has outgrown most major economies. As shown in Fig. 1 below, China’s share in global GDP has increased from 9% in 2010 to 19% in 2022, overtaking Japan as the second largest economy in the world. While the global economic environment remains somewhat uncertain we believe China will be a relative bright spot and continue to grow, albeit perhaps at lower rates than it historically achieved. In contrast, China’s weight in the MSCI All Country World Index remained low with a weighting still below Japan and the UK for example within the MSCI All Country World index and just above the one from Canada. Given the importance of China to the global economy and stock markets, a top-up approach of China equity allocation is advocated to fairly reflect China’s current status.
China's Economy Under-represented in Global Equity Indices
(Fig. 1) The China investment opportunity
Past performance is not a reliable indicator of future performance.
1 UBS, IMF, March 2021.
2 Goldman Sachs, 31 March 2021.
3 FactSet; T. Rowe Price calculations using data from FactSet Research System Inc. All rights reserved. ‘Disruptive Tech’ is defined as the Information Technology sector, the Internet & Direct Marketing. Retail industry within the Consumer Discretionary sector, and the Media & Entertainment industry group within the Communication Services sector.
4 OECD,2020.
* IMF, World Economic Outlook Database, USD, estimates, April 2022.
5 World Bank/Haver Analytics, MSCI. Please see Additional Disclosures page for information on this MSCI information.
China Market Too Big to Ignore
(Fig. 2) Major equity markets market cap and turnover
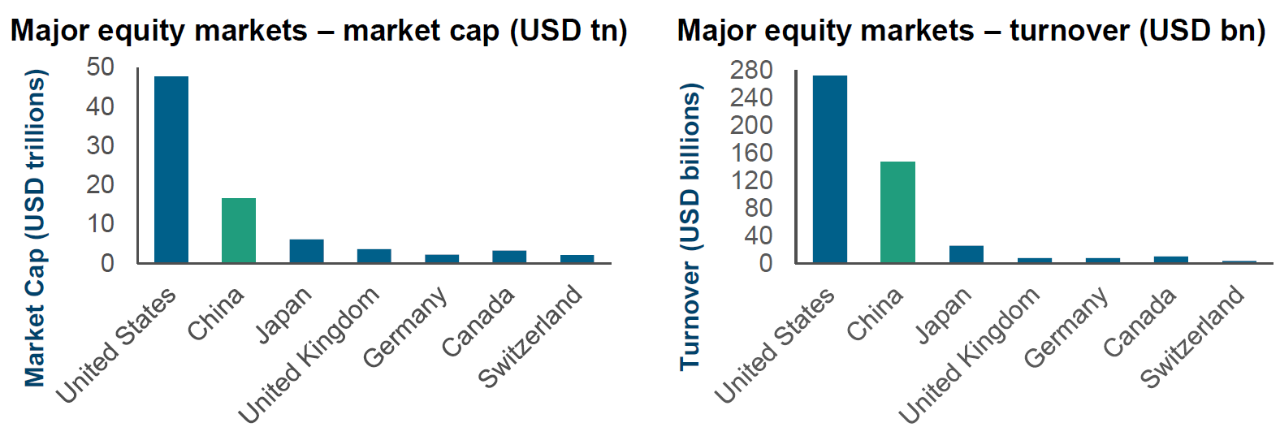
Source: Goldman Sachs, Morgan Stanley Research. Data as of 31 Dec 2020.
The total size of China's equity markets is hard to ignore. As we can see in Fig. 2, it has won the silver medal among all global equity markets in terms of both market capitalization and trading volume. The growth in the investable universe has been allied to market access reforms that make investing in the entire China universe much easier than ever before. China has now grown to a large liquid universe that is incredibly dynamic in terms of composition as new innovative, disruptive businesses emerge.
2. China Equity Is a Good Diversifier
While higher economic growth is often quoted as the primary reason for allocating to China equity markets, the direct link between GDP and stock market returns remains to be seen in China. We believe that the real attraction of Chinese equity stems from the enhancements it can make to an overall equity portfolio as a good diversifier.
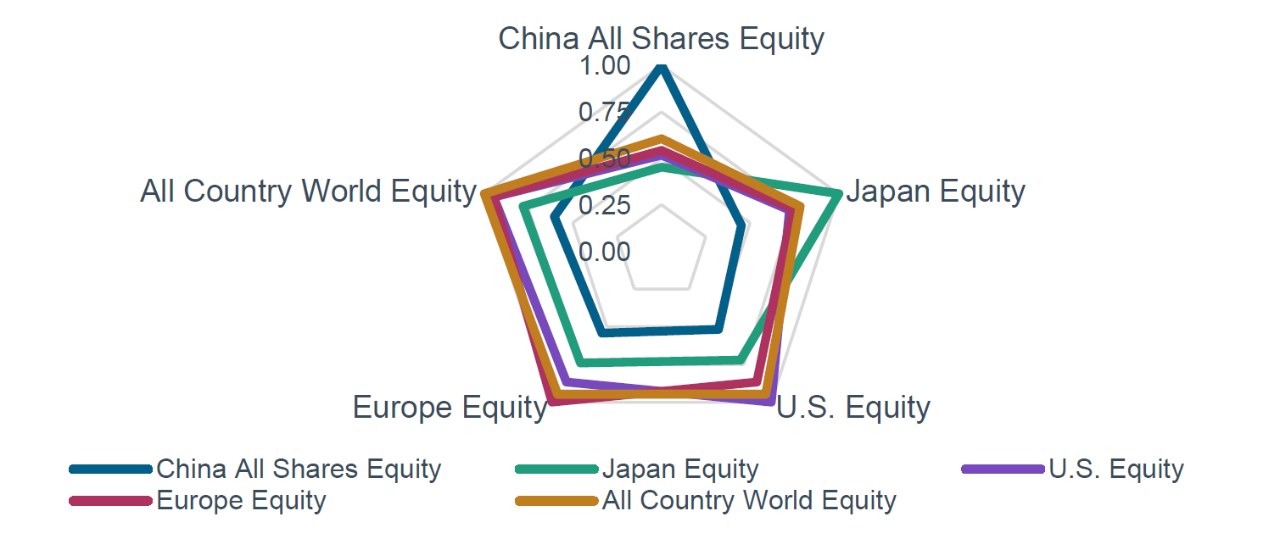
Figure 3 shows the monthly return correlations between major equity markets. The center of the chart represents zero correlation, and correlation increases from the center to the outside. Chinese equity, which is represented by the light blue line, showed lower correlations to other major equity markets. This could at least partially be attributed to China’s closed market structure, corporate governance, and political backdrop. Besides, the dominating ownership of China equity markets by domestic market participants, who are relatively insulated from global factors, may also have a role to play. Lastly, the fact that China demonstrates its own business cycles adds to its diversification benefits.
China Is Less Correlated with Other Equity Markets
(Fig. 3) Monthly Return Correlations
3. Most China Equity Indices Concentrated in Mega-cap Stocks
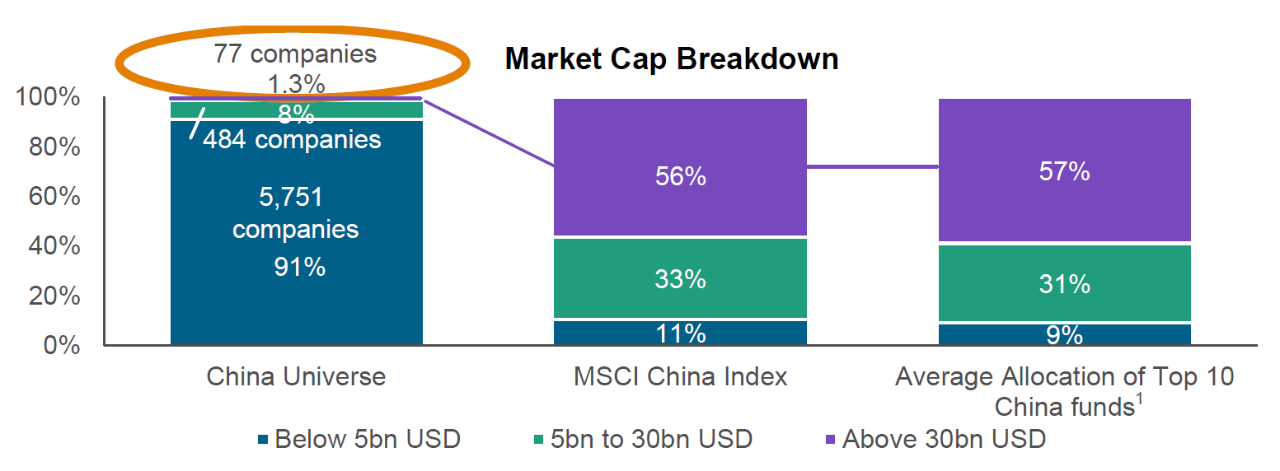
Looking under the hood, the market- cap-weighted MSCI China index shows high concentration on the largest companies. Out of the 6,000+ companies in the China equity universe, the weight of the largest 77 companies counts for more than half of the MSCI China index (See Fig. 4). However, in a market as dynamic as China, the exciting alpha opportunities lie in the companies that can become the winners of tomorrow, which tend to exist outside of the mega-cap space and thus are often overlooked by many international investors. This reality creates inefficiencies that active fundamental managers can exploit and makes the case for a top up allocation to China equity focusing on the under-represented stocks. Selective investments in small and mid-cap companies can broaden the exposure to various drivers of the Chinese economy.
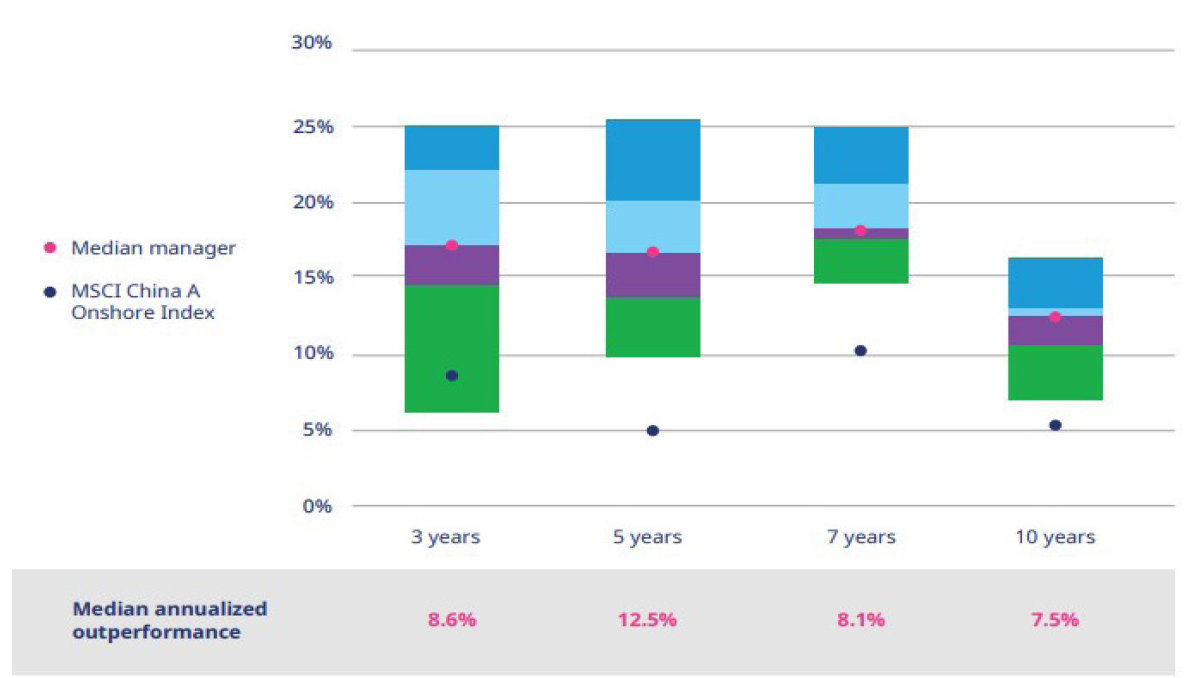
4. China Provides an Abundance of Alpha Opportunities
Chinese companies are typically under researched relative to international peers. This is especially true when you look outside of the well owned mega cap stocks as well as the A-share market which has a largely domestic, retail driven investor base. Moreover, China's stock market, especially the A-share market, is driven by high retail participation. These two conditions create inefficiencies that skilled managers can harvest. In investment consultant Mercer’s 2021 paper “Positioning your portfolio for the future of emerging markets”1, it studied the universe of all active China A-share managers available on its platform, and calculated the managers’ active performance relative to the MSCI China A Onshore Index over various time horizons. As shown in the bar chart below (See Fig. 5), as of December 31st, 2020, the median Chinese equity manager was able to generate compelling annualized excess returns ranging from 7.5% to 12.5% gross of fees vs. the passive index depending on the time periods.
Popular China Indices Favor the Largest Companies
(Fig. 4) China Universe vs. MSCI China and Top 10 Funds
Sources: MSCI, HKex, FactSet, Wind, Morningstar. Financial data and analytics provider FactSet. Copyright 2022 FactSet. All Rights Reserved.
Please see Additional Disclosures page for information about this MSCI and Morningstar information.
1 The Top 10 China funds refer to the funds in the Morningstar China Equity universe, measured by AUM.
Numbers may not total due to rounding. Cash is excluded from the analysis.
The market cap breakdown of China Universe is based on stock count while the market cap breakdown of MSCI China Index and Average Allocation of Top 10 China funds is based on dollar value of assets held.
China Equities and Alpha Generation
(Fig. 5) China A-share universe performance (to end-December 2020)
Source: MercerInsight®. As at December 31, 2020 gross of fees. https://www.mercer.com/content/ dam/mercer/attachments/global/gl-2021-long-em-and-china.pdf.
5. Complimenting Your Existing China Exposure
T. Rowe Price China Evolution Equity takes a holistic approach to investing in China and looks for the best risk/ reward proposition across the full spectrum of greater-China markets. The strategy excludes the top 100 companies by market capitalization in the China universe and provides exposure to the more dynamic and inefficient part of the market by investing in stocks that are typically overlooked by other investors. Based on data at the end of June 30th 2022, we estimated that the overlap between our T Rowe Price China Evolution strategy and the MSCI EM index was only 2.6% while the overlap between MSCI China All Shares index and the MSCI EM index was 35.8%. This reinforces the benefits of a differentiated active China strategy to be used in the top up framework as opposed to an index based approach.
Summary and Conclusions
China as the world’s second largest stock market by market cap is significantly underrepresented in broad market indices. Mercer’s frequently viewed research “Positioning your portfolio for the future of emerging markets”1 even took a step further to zoom in to China onshore markets. Research by ourselves and Mercer’s came to the same conclusion that an increased China allocation in an EM equity portfolio can enhance investment outcomes by taking advantage of China’s dominant economic position, attractive diversification benefits and abundant alpha opportunities.

IMPORTANT INFORMATION
This material is being furnished for general informational and/or marketing purposes only. The material does not constitute or undertake to give advice of any nature, including fiduciary investment advice, nor is it intended to serve as the primary basis for an investment decision. Prospective investors are recommended to seek independent legal, financial and tax advice before making any investment decision. T. Rowe Price group of companies including T. Rowe Price Associates, Inc. and/or its affiliates receive revenue from T. Rowe Price investment products and services. Past performance is not a reliable indicator of future performance. The value of an investment and any income from it can go down as well as up. Investors may get back less than the amount invested.
The material does not constitute a distribution, an offer, an invitation, a personal or general recommendation or solicitation to sell or buy any securities in any jurisdiction or to conduct any particular investment activity. The material has not been reviewed by any regulatory authority in any jurisdiction.
Information and opinions presented have been obtained or derived from sources believed to be reliable and current; however, we cannot guarantee the sources’ accuracy or completeness. There is no guarantee that any forecasts made will come to pass. The views contained herein are as of the date written and are subject to change without notice; these views may differ from those of other T. Rowe Price group companies and/or associates. Under no circumstances should the material, in whole or in part, be copied or redistributed without consent from T. Rowe Price.
The material is not intended for use by persons in jurisdictions which prohibit or restrict the distribution of the material and in certain countries the material is provided upon specific request. It is not intended for distribution to retail investors in any jurisdiction.
January 2023 / INVESTMENT INSIGHTS

Thomas Poullaouec is the head of Multi-Asset Solutions, APAC, and a portfolio manager in the Multi-Asset Division. He is a vice president and the chair of the Asian, Australian, and Japanese Investment Committees. He also is the regional sponsor of WAVE, T. Rowe Price’s business resource group whose mission is to support the firm by increasing its ability to attract, develop, advance, and retain talented and principled women.

Robert Secker is a portfolio specialist representing the firm’s Asian and Chinese equity strategies to institutional clients, consultants, and prospects in the Equity Division. He is a vice president of T. Rowe Price International Ltd.

Nathan Wang is a senior solutions analyst for the Multi-Asset Solutions team in the Multi-Asset Division. He is a vice president of T. Rowe Price Hong Kong Limited.