
Tactical Asset Allocation: Thinking About Growth vs. Value
Executive Summary
- Growth and value cycles tend to persist for long periods of time, and the growth style of equity investing has outperformed the value style since the 2008 global financial crisis—its longest outperformance streak on record.
- Relative valuations, sector composition, and macroeconomic factors such as interest rates, inflation, and growth historically have been the primary drivers of relative performance for the two styles.
- Recent market developments such as valuation convergence, higher short-term interest rates in the U.S., and deregulation of the financials sector could cause an inflection point in the growth/value cycle.
- Investors potentially can prepare for this outcome by holding portfolios that not only strike a balance between value and growth but are also actively managed to adapt to new regimes.
In theory, the value style of equity investing should outperform the growth style over the long term because the former approach favors stocks selling at prices that potentially are below their intrinsic values. Given a sufficiently long investment horizon, prices eventually should converge to fair value.
A behavioral explanation for the historical value premium is that investors tend to over-extrapolate past returns into the future. Investors tend to be too negative about stocks that have performed badly in the past and too positive about stocks that have performed strongly. Value, therefore, potentially works because investors tend to be too pessimistic about cheap stocks and too optimistic about expensive stocks.
This is the theory. In practice, however, value has underperformed growth since 2007, the longest growth cycle on record. Have the tides shifted? Is it the end of a 100-year-long value cycle? To answer these questions, we need to understand the factors driving the relative performance of growth and value.
WHEN VALUE BECAME MORE EXPENSIVE THAN GROWTH
Like other equity assets, value and growth stocks historically have gone through valuation cycles. Figure 1, shows that growth stocks typically have had higher price/earnings (P/E) ratios than value stocks, which is not surprising given that one definition of a value stock is a relatively low P/E. However, in 2008 the P/E of the Russell 1000 Value Index surpassed that of the Russell 1000 Growth Index.
The switch in relative valuations may have been one of the catalysts that launched the current growth cycle. However, in 2010 the Russell 1000 Value Index P/E fell back below the Russell 1000 Growth Index P/E. So, while valuation might have helped trigger a growth cycle, it doesn’t seem to explain its persistence.
Figure 1: Growth and Value P/Es and Relative Style Performance
Russell 1000 Growth Minus Russell 1000 Value
Rolling 36-Month Annualized Returns Through 31May 2018
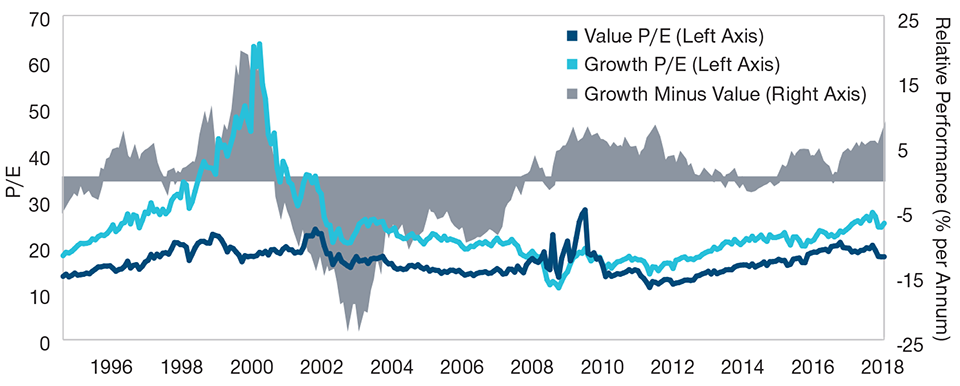
Past performance is not a reliable indicator of future performance.
Sources: FTSE Russell/Bloomberg Index Services, Inc.; all data analysis by T. Rowe Price. Bloomberg Index Services Ltd. Copyright © 2018, Bloomberg Index Services Ltd. Used with permission.
SECTORS: TECHNOLOGY AND FINANCIALS
From 2008 through early 2018, a select group of large-cap companies with dominant technology platforms not only succeeded but exceeded expectations. These companies are sometimes referred to as the FAANG stocks—Facebook, Apple, Amazon, Netflix, and Google. Over the same time period, the financials sector broadly performed in line with the general stock market. Low interest rates and a flat yield curve, coupled with tighter regulation and intense competition, dented the profitability of banks and financial services firms in general.
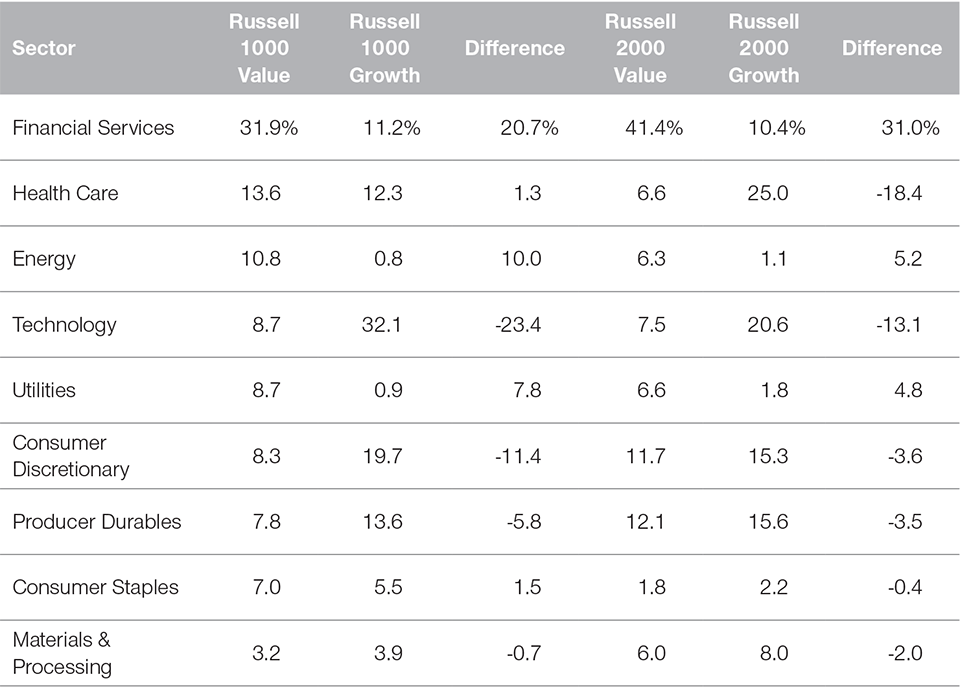
These sector trends appear to have played an important role in relative style performance. Looking at the sector composition of value and growth, the Russell 1000 Value Index is overweight in financials while technology has a heavy weight in the Russell 1000 Growth Index (Figure 2).
Figure 2: Sector Composition of Russell Style Indexes
As of 31 Mar 2018
Source: FTSE Russell.
As Figure 3 shows, relative sector performance—as measured by returns for the S&P technology sector minus returns for the S&P financials sector—has broadly tracked the relative performance of the Russell 1000 Growth Index versus the Russell 1000 Value Index. In other words, the outperformance of tech and the market-average performance of financials since 2008 appear to explain much of the current growth cycle.
Figure 3: Performance of Technology Less Financials, and Growth Less Value
S&P Technology Sector Minus S&P Financials Sector; Russell 1000 Growth Minus Russell 1000 Value
Rolling 12-Month Returns Through 31 May 2018
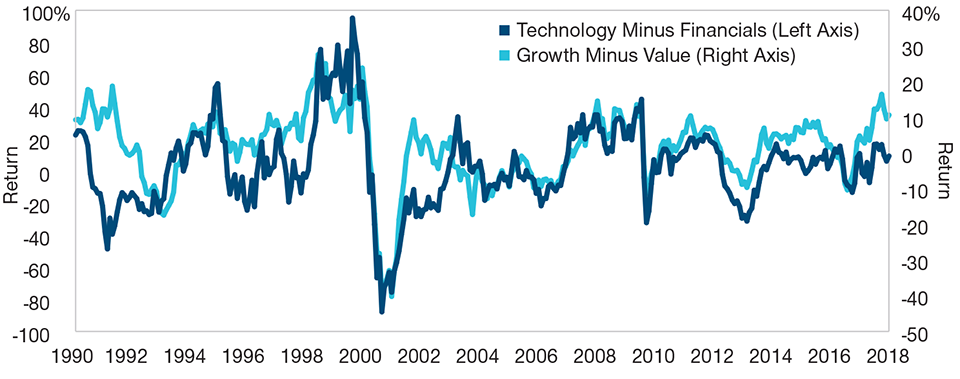
Past performance is not a reliable indicator of future performance.
Sources: S&P and FTSE Russell/Bloomberg Index Services, Inc.; all data analysis by T. Rowe Price.
INTEREST RATES, INFLATION, AND ECONOMIC GROWTH
Value stocks typically have higher dividend yields than growth stocks because distributing cash to shareholders is often a more efficient use of capital for low-growth companies. As a result, the expected cash flows of growth stocks typically are further in the future compared with value stocks. In other words, growth stocks generally can be expected to have longer duration than value stocks. This means growth stocks are normally more sensitive to changes in interest rates than value stocks.
Since 2008, due to the relatively slow pace of economic growth, the prolonged economic recovery, and quantitative easing by the Federal Reserve, growth stocks in general have benefited from low inflation and low interest rates. These factors also may have contributed to the length of the current growth cycle.
CONCLUSION
Starting with the global financial crisis in 2008, a unique combination of low rates, strong technology performance, the slow pace of economic growth, and valuations that initially favored growth stocks created a perfect storm of conditions supporting the growth style (Figure 4).
Figure 4: Treasury Yields, Style P/Es, Relative Technology Returns, and Relative
Style Returns*
Rolling 36-Month Returns Through 31 May 2018
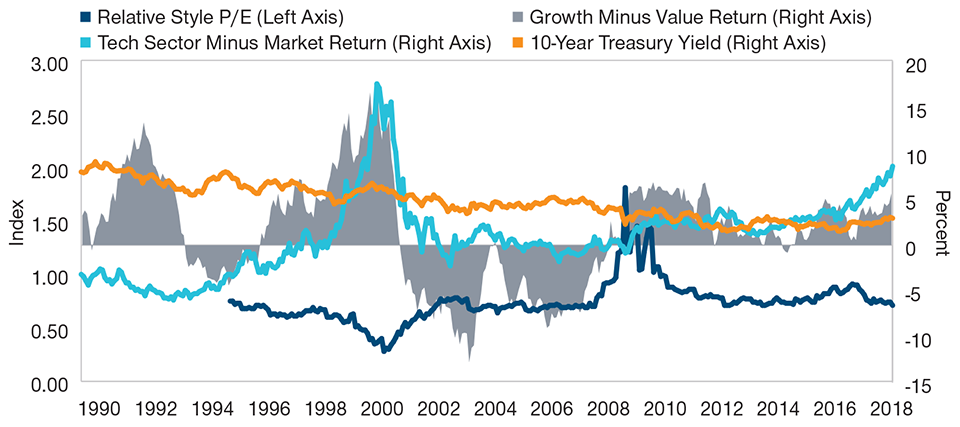
Past performance is not a reliable indicator of future performance.
Sources: S&P and FTSE Russell/Bloomberg Index Services, Inc.; all data analysis by T. Rowe Price.
*Treasury yield = constant-maturity 10-year Treasury yield; style P/Es = Russell 1000 Growth and Russell 1000 Value Indexes; relative technology returns = S&P technology sector minus S&P 500 Index.
The big question now is whether these conditions will continue to hold. Rates in the U.S. have been moving higher; tech potentially might lose momentum due to relatively rich valuations and additional regulation; financials could fare better due to rising yields and deregulation; and valuations no longer favor growth. Any of these factors could produce a comeback for value.
In our view, investors should prepare for a potential shift in relative style performance by ensuring their portfolios are appropriately balanced between value and growth. Actively managed strategies, based on in-depth fundamental research, potentially can adjust to market inflections far better than momentum-driven strategies.
 In our view, investors should prepare for a potential shift in relative style performance by ensuring their portfolios are appropriately balanced between value and growth.

Important Information
This material is being furnished for general informational purposes only. The material does not constitute or undertake to give advice of any nature, including fiduciary investment advice, and prospective investors are recommended to seek independent legal, financial and tax advice before making any investment decision. T. Rowe Price group of companies including T. Rowe Price Associates, Inc. and/or its affiliates receive revenue from T. Rowe Price investment products and services. Past performance is not a reliable indicator of future performance. The value of an investment and any income from it can go down as well as up. Investors may get back less than the amount invested.
The material does not constitute a distribution, an offer, an invitation, a personal or general recommendation or solicitation to sell or buy any securities in any jurisdiction or to conduct any particular investment activity. The material has not been reviewed by any regulatory authority in any jurisdiction.
Information and opinions presented have been obtained or derived from sources believed to be reliable and current; however, we cannot guarantee the sources’ accuracy or completeness. There is no guarantee that any forecasts made will come to pass. The views contained herein are as of the date written and are subject to change without notice; these views may differ from those of other T. Rowe Price group companies and/or associates. Under no circumstances should the material, in whole or in part, be copied or redistributed without consent from T. Rowe Price.
The material is not intended for use by persons in jurisdictions which prohibit or restrict the distribution of the material and in certain countries the material is provided upon specific request.
It is not intended for distribution to retail investors in any jurisdiction.
Australia—Issued in Australia by T. Rowe Price Australia Limited (ABN: 13 620 668 895 and AFSL: 503741), Level 50, Governor Phillip Tower, 1 Farrer Place, Suite 50B, Sydney, NSW 2000, Australia. For Wholesale Clients only.
Canada—Issued in Canada by T. Rowe Price (Canada), Inc. T. Rowe Price (Canada), Inc.’s investment management services are only available to Accredited Investors as defined under National Instrument 45-106. T. Rowe Price (Canada), Inc. enters into written delegation agreements with affiliates to provide investment management services.
DIFC—Issued in the Dubai International Financial Centre by T. Rowe Price International Ltd. This material is communicated on behalf of T. Rowe Price International Ltd. by its representative office which is regulated by the Dubai Financial Services Authority. For Professional Clients only.
EEA—Issued in the European Economic Area by T. Rowe Price International Ltd, 60 Queen Victoria Street, London EC4N 4TZ which is authorised and regulated by the UK Financial Conduct Authority. For Professional Clients only.
Hong Kong—Issued in Hong Kong by T. Rowe Price Hong Kong Limited, 21/F, Jardine House, 1 Connaught Place, Central, Hong Kong. T. Rowe Price Hong Kong Limited is licensed and regulated by the Securities & Futures Commission. For Professional Investors only.
New Zealand—Issued in New Zealand by T. Rowe Price Australia Limited (ABN: 13 620 668 895 and AFSL: 503741), Level 50, Governor Phillip Tower, 1 Farrer Place, Suite 50B, Sydney, NSW 2000, Australia. No Interests are offered to the public. Accordingly, the Interests may not, directly or indirectly, be offered, sold or delivered in New Zealand, nor may any offering document or advertisement in relation to any offer of the Interests be distributed in New Zealand, other than in circumstances where there is no contravention of the Financial Markets Conduct Act 2013.
Singapore—Issued in Singapore by T. Rowe Price Singapore Private Ltd., No. 501 Orchard Rd, #10-02 Wheelock Place, Singapore 238880. T. Rowe Price Singapore Private Ltd. is licensed and regulated by the Monetary Authority of Singapore. For Institutional and Accredited Investors only.
Switzerland—Issued in Switzerland by T. Rowe Price (Switzerland) GmbH, Talstrasse 65, 6th Floor, 8001 Zurich, Switzerland. For Qualified Investors only.
USA—Issued in the USA by T. Rowe Price Associates, Inc., 100 East Pratt Street, Baltimore, MD, 21202, which is regulated by the U.S. Securities and Exchange Commission. For Institutional Investors only.
T. ROWE PRICE, INVEST WITH CONFIDENCE, and the bighorn sheep design are, collectively and/or apart, trademarks of T. Rowe Price Group, Inc. © 2018 T. Rowe Price. All rights reserved.
ID0001613
201807-550888