January 2023 / MARKETS & ECONOMY
Integrated Equity Quarterly Newsletter
COVID Camouflage and the Risk of Declining Earnings in 2023
Quarterly Factor Returns
(Fig. 1) October 1, 2022–December 31, 2022
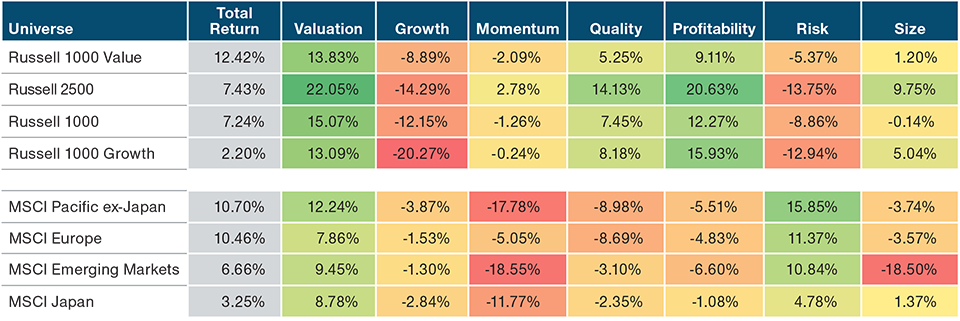
Past performance is not a reliable indicator of future performance.
Sources: IDC data/Refinitiv, Compustat, Worldscope/Refinitiv, Russell, MSCI. Analysis by T. Rowe Price. See Additional Disclosures. MSCI returns are in local currency.
Factor returns are calculated as equal-weighted quintile spreads. Please see Appendix for more details on the factors.
On the surface, the fourth quarter of 2022 featured a welcome rebound for global markets, which generally rose 5%–10%. However, below the surface, we noted three interesting dynamics:
Factors diverged significantly between the U.S. and the rest of the world—a tentative, low-conviction rally in the U.S. alongside a more traditional rally in risk assets outside the U.S.
- Figure 1 is sorted by region this quarter to highlight that while all featured markets were positive, the underlying factor performance was quite different. Within the U.S., this was a defensive market recovery with growth and risk continuing to underperform and quality and profitability continuing to outperform. Outside the U.S., the recovery was led by risk and low quality, with profitability underperforming and growth nearly flat. Our takeaway is that non-U.S. market behavior fits the classic risk rally—either a bear market rally or a sustainable market turn—whereas the U.S. rally appeared to be a tentative, low-conviction rally that is atypical of historical market bottoms.
Performance of High and Low Risk in U.S. and Europe
(Fig. 2) September 30, 2022–December 30, 2022

Past performance is not a reliable indicator of future performance.
Sources: IDC data/Refinitiv, Russell, and MSCI. Analysis by T. Rowe Price. See Additional Disclosures. Factor returns are calculated as equal-weighted quintile spreads. Please see Appendix for more details on the factors.
The period featured a significant mid-quarter risk rally, followed by different global responses
- Markets and risk rallied significantly in mid-November following a U.S. consumer price index report suggesting that inflation was slowing more than expected and that the Federal Reserve could slow the pace of tightening. Using the Russell 1000 and MSCI Europe indexes as proxies, high-risk stocks rallied sharply while low-risk stocks were more flat (Figure 2). Through this point, the performance of high- and low-risk stocks was directionally similar in both regions. The key difference was how each region responded—high-risk stocks held their gains in Europe but gave all of them up in the U.S., driving the divergence mentioned earlier. We believe this reinforces the notion of a low-conviction rally in U.S. markets.
One constant was the continued global outperformance of value over growth
- Despite these differences, the one constant was a continued rotation from growth into value. In all regions, value outperformed growth fairly continuously, with performance spreads largest in the U.S. but still present in Europe and emerging markets (Figure 3).
Value vs. Growth Long-Short Factor Returns
(Fig. 3) September 30, 2022–December 30, 2022

Past performance is not a reliable indicator of future performance.
Sources: IDC data/Refinitiv, Compustat, Worldscope/Refinitiv, Russell, and MSCI. Analysis by T. Rowe Price. See Additional Disclosures.
Factor returns are calculated as equal-weighted quintile spreads. Please see Appendix for more details on the factors.
Market Insight—What We’re Monitoring
In our third-quarter 2022 newsletter, we discussed our expectations for earnings declines in 2023. In this newsletter, we dig deeper into an area that we see increasingly driving this risk—companies that over-invested due to the economic tailwinds from the pandemic.
The risks of over-investment
Historically, companies with the highest capital expenditures (capex) typically underperformed (Figures 4 and 5). Why is this the case?
- Managements over-extrapolate strong cycles and invest at the top of cycles
- Managements become enamored with growth and empire-building
U.S. Performance of Capex/Sales and Capex Growth, 1985–2022
(Figs. 4 and 5)


Past performance is not a reliable indicator of future performance.
Sources: IDC data/Refinitiv, Compustat, Russell. Analysis by T. Rowe Price. The universe of stocks for this analysis is the union of the Russell 1000 Index and the Russell 2500 Index. Stocks are sorted monthly on the noted metrics.
We recognize this relationship may have changed as the economy has shifted from manufacturing to services, where accumulated investment in “organizational capital” (research and development, people, and brands) may bring long-term benefits. Nevertheless, current heightened spending reflects behavioral biases, and over-investment in organizational capital—particularly at the peak of cycles—risks destroying shareholder value.
The challenge today: COVID Camouflage
We think one of the main risks for 2023 is COVID Camouflage.
- Most investors now recognize the first-order bubble in stay-at-home pandemic beneficiaries: video conferencing, home workouts, streaming services, and outdoor leisure.
- We think investors still underappreciate the second- and third-order effects where fundamentals have been “camouflaged” by COVID—e.g., stocks where either the market hasn’t priced in reversion to the mean or where management has acted as though the benefits were permanent. We see this in areas such as online retail, transportation and logistics, cloud and software providers, online advertising, and building and construction.
More specifically, we believe over-investment (capex, employee growth) is a prime example of management teams being misled by COVID Camouflage: Management teams over-extrapolated recent profitability and over-invested in their businesses without recognizing the transitory revenue tailwinds. For example, U.S. companies’ aggregate revenue is approximately 14% above its long-term trend following the “pandemic boost” (Figure 6). In response, companies with the highest levels of capex and employee growth are also spending at the highest levels since at least the early 2000s (Figures 7 and 8). This behavior, which reflects the tendency of management to overspend at the peak of cycles, may not be different for the services economy.
U.S. Annual Corporate Revenue
(Fig. 6) March 31, 1985–September 30, 2022 (Russell 3000 Index)

Source: Compustat. Analysis by T. Rowe Price. See Additional Disclosures.
The linear trend line represents the long-term trend during the 1985-2019 time frame. Beyond 2019 is an extrapolation of that pre-pandemic trend and is shown for illustrative purposes only.
Companies that have over-invested will face heightened margin pressure with structurally higher expense bases as topline growth recedes. We expect this to be one of the main drivers of earnings declines in 2023. Using history as a guide, this could lead to potentially significant stock underperformance.
Median Capex Growth and Employee Growth for Highest Quintiles of Each
(Figs. 7 and 8)


Sources: Compustat. Analysis by T. Rowe Price. See Additional Disclosures. The universe of stocks for this analysis is the union of the Russell 1000 Index and the Russell 2500 Index. Stocks are sorted monthly on the noted metrics.
While Figure 5 shows the “base rate” for companies that have increased capex most aggressively, that doesn’t tell the full story—when capex growth has been the most aggressive, forward (or subsequent) returns have tended to be the most negative with over 60% greater underperformance (Figure 9).
Finally, the idea of COVID Camouflage is broadly important. For example, our second-quarter 2022 newsletter focused on the emerging risk of stock-based compensation (SBC), which is another example of COVID Camouflage. As stimulative monetary and fiscal policies drove equity multiples higher, companies benefited from widespread use of SBC and reported inflated cash flows; now, as stocks have corrected, managements face difficult decisions that are likely to decrease earnings, such as switching to cash compensation and accepting higher employee turnover.
Summary
In summary, 2022 was a pivot year for the Fed and for markets—rising inflation led to monetary tightening, which triggered sharp rotations from growth/long duration/high risk into value/short duration/low risk. In many ways, this represented an unwinding of COVID-driven distortions in the market. However, companies that erroneously extrapolated COVID trends into the future need to make a similar pivot. Their businesses will feel pressure from both ends as the tailwinds from COVID revenues continue to dissipate, while the headwinds of structural expenses impair margins. We continue to focus on earnings quality and companies demonstrating prudent expense management.
Forward 12-Month Returns to High-Low Capex Firms
(Fig. 9) 1985–2022

Past performance is not a reliable indicator of future performance.
*“Peak capex periods” defined as any quarters with at least 35% trailing annual capex growth. Returns are through December 31, 2022.
Sources: IDC data/Refinitiv, Compustat, Russell. Analysis by T. Rowe Price.
See Additional Disclosures. The universe of stocks for this analysis is the union of the Russell 1000 Index and the Russell 2500 Index.
Appendix
Factors are our internally constructed metrics defined as follows:
Valuation: Proprietary composite of valuation metrics based on earnings, sales, book value, and dividends. Specific value factor weighting may vary by region and sector.
Growth: Proprietary composite of growth metrics based on historical and forward-looking earnings and sales growth. Factor selection and weighting vary by region and industry.
Momentum: Proprietary measure of medium-term price momentum.
Quality: Proprietary measure of quality based on fundamental and stock price stability, balance sheet strength, various measures of profitability, capital usage, and earnings quality.
Profitability: Return on equity.
Risk: Proprietary composite capturing stock return stability over multiple time horizons (positive return means risky stocks outperform stable stocks).
Size: Market capitalization (positive return means larger stocks outperform smaller stocks).
T. Rowe Price cautions that economic estimates and forward-looking statements are subject to numerous assumptions, risks, and uncertainties, which change over time. Actual outcomes could differ materially from those anticipated in estimates and forward-looking statements, and future results could differ materially from historical performance. The information presented herein is shown for illustrative, informational purposes only. Forecasts are based on subjective estimates about market environments that may never occur. The historical data used as a basis for this analysis are based on information gathered by T. Rowe Price and from third‑party sources and have not been independently verified. Forward-looking statements speak only as of the date they are made, and T. Rowe Price assumes no duty to and does not undertake to update forward-looking statements.
Additional Disclosures
Copyright © 2023, S&P Global Market Intelligence (and its affiliates, as applicable). Reproduction of any information, data or material, including ratings (“Content”) in any form is prohibited except with the prior written permission of the relevant party. Such party, its affiliates and suppliers (“Content Providers”) do not guarantee the accuracy, adequacy, completeness, timeliness or availability of any Content and are not responsible for any errors or omissions (negligent or otherwise), regardless of the cause, or for the results obtained from the use of such Content. In no event shall Content Providers be liable for any damages, costs, expenses, legal fees, or losses (including lost income or lost profit and opportunity costs) in connection with any use of the Content. A reference to a particular investment or security, a rating or any observation concerning an investment that is part of the Content is not a recommendation to buy, sell or hold such investment or security, does not address the suitability of an investment or security and should not be relied on as investment advice. Credit ratings are statements of opinions and are not statements of fact.
© 2023 Refinitiv. All rights reserved.
London Stock Exchange Group plc and its group undertakings (collectively, the “LSE Group”). © LSE Group 2023. All rights in the FTSE Russell indexes or data vest in the relevant LSE Group company which owns the index or the data. Neither LSE Group nor its licensors accept any liability for any errors or omissions in the indexes or data and no party may rely on any indexes or data contained in this communication. No further distribution of data from the LSE Group is permitted without the relevant LSE Group company’s express written consent. The LSE Group does not promote, sponsor or endorse the content of this communication.
Source: MSCI. MSCI and its affiliates and third party sources and providers (collectively, “MSCI”) makes no express or implied warranties or representations and shall have no liability whatsoever with respect to any MSCI data contained herein. The MSCI data may not be further redistributed or used as a basis for other indices or any securities or financial products. This report is not approved, reviewed, or produced by MSCI. Historical MSCI data and analysis should not be taken as an indication or guarantee of any future performance analysis, forecast or prediction. None of the MSCI data is intended to constitute investment advice or a recommendation to make (or refrain from making) any kind of investment decision and may not be relied on as such.
IMPORTANT INFORMATION
This material is being furnished for general informational and/or marketing purposes only. The material does not constitute or undertake to give advice of any nature, including fiduciary investment advice, nor is it intended to serve as the primary basis for an investment decision. Prospective investors are recommended to seek independent legal, financial and tax advice before making any investment decision. T. Rowe Price group of companies including T. Rowe Price Associates, Inc. and/or its affiliates receive revenue from T. Rowe Price investment products and services. Past performance is not a reliable indicator of future performance. The value of an investment and any income from it can go down as well as up. Investors may get back less than the amount invested.
The material does not constitute a distribution, an offer, an invitation, a personal or general recommendation or solicitation to sell or buy any securities in any jurisdiction or to conduct any particular investment activity. The material has not been reviewed by any regulatory authority in any jurisdiction.
Information and opinions presented have been obtained or derived from sources believed to be reliable and current; however, we cannot guarantee the sources’ accuracy or completeness. There is no guarantee that any forecasts made will come to pass. The views contained herein are as of the date written and are subject to change without notice; these views may differ from those of other T. Rowe Price group companies and/or associates. Under no circumstances should the material, in whole or in part, be copied or redistributed without consent from T. Rowe Price.
The material is not intended for use by persons in jurisdictions which prohibit or restrict the distribution of the material and in certain countries the material is provided upon specific request. It is not intended for distribution to retail investors in any jurisdiction.