


- On U.S. Fixed Income
- Ten Years of Seeking to Exploit Inefficiencies in High Yield
- Long‑tenured manager uses a flexible, concentrated approach.
- 2023-05-17 02:14
- Kevin Loome, CFA Portfolio Manager, U.S. High Yield Fund
- Key Insights
-
- Kevin Loome celebrated 10 years of managing the fund, which ranked in the top 4% of the 526 funds in Morningstar’s high yield bond category since inception for cumulative total return.1
- The fund seeks to take advantage of market inefficiencies and generate alpha through credit‑intensive, bottom‑up fundamental research.
- The high yield market is constantly evolving, but the team sees many opportunities to continue to exploit inefficiencies through its rigorous investment process.
The U.S. High Yield Fund outperformed its benchmark, the ICE BofA US High Yield Constrained Index, and returned 4.55% annually over the 10 years ended April 30, 2023.1 Over this same time period, the fund’s cumulative total return ranked in the top 4% of the 526 funds in Morningstar’s high yield bond category and offered strong relative risk‑adjusted returns.1
In this Q&A, Kevin Loome discusses the team’s investment process and how in‑depth research into individual companies and industries gives him conviction to actively position the fund in the team’s best ideas through a concentrated approach. Additionally, he shares his insights on the evolution of the U.S. high yield market over the last 10 years and key factors that he expects will influence the market in the future.
How would you describe your investment approach?
I think of our approach to managing high yield debt as flexible and nimble. The core of our team has been together for over 15 years and has managed together through multiple market cycles. Our flexibility, in particular, is a key differentiator versus competitors, in my view. As a relatively small fund, we can rapidly pivot to become more defensive or to take advantage of opportunities when the market environment changes.
For instance, when oil prices began to drop in 2014, pressuring the energy‑heavy broad high yield bond market, this flexibility allowed us to quickly reduce risk in the portfolio. Some of our larger peers were not able to sell all of a particular holding if they needed or wanted to.
In an example of pivoting to offense, we expeditiously moved to add risk exposure at the onset of the coronavirus pandemic when certain bonds became available at dislocated prices that did not reflect their true credit quality. We believe our ability to recognize and take advantage of these opportunities serves as a sustainable long‑term advantage of our investment approach that can lead to meaningful alpha2 generation over time.
Your fund takes a concentrated, best ideas approach, typically investing in just 100 to 200 issuers. How did you arrive at these guidelines?
As we have written about recently, we are strong believers in the benefits of active management in high yield. With around 100 to 200 issuers typically in the portfolio, our fund is significantly more concentrated than the benchmark—the ICE BofA US High Yield Constrained Index has about 1,000 names—and most peers.
We believe this level of concentration strikes an appropriate balance between providing proper diversification and delivering a portfolio of best ideas to our clients. It also reflects the fact that we strive to add alpha primarily through credit selection and, to a lesser extent, through our top‑down macro views. We perform in‑depth bottom‑up fundamental credit analysis to uncover and take advantage of market inefficiencies that may arise due to an issuer’s size, geography, lack of coverage by sell‑side analysts, or general misconceptions in the marketplace. When building the portfolio, we manage individual position sizes based on our level of conviction while taking factors such as liquidity and other risks into account.
What are some of the key features and unique aspects of your team’s investment process?
Our team has a very collaborative culture—the traders, credit analysts, and me all sit in the same location to facilitate easy, rapid information sharing. The entire investment team is dedicated to only this one single strategy, which is relatively uncommon in the industry. All team members actively participate in the investment process, which includes two or three individual credit reviews per week, monthly attribution meetings, and twice‑yearly offsites where we analyze and review every portfolio holding. Our collaborative team in combination with a concentrated approach helps ensure that every name in our portfolio has been heavily vetted and that no name gets overlooked or left unattended. It also creates constant friction for best ideas.
"The entire investment team is dedicated to only this one single strategy...."
In terms of the credit research process itself, we assign a proprietary credit rating, spread3 target, and environmental, social, and governance (ESG) score to every issuer we assess. These proprietary ratings help us be more forward‑looking so that we can identify inefficiencies, stay ahead of market trends, and anticipate ratings actions before they happen. Our spread and total return targets force us to identify future potential sources of alpha and create a natural sell discipline in our portfolio. We also meet quarterly with T. Rowe Price Investment Management’s team of ESG analysts, who provide valuable company‑specific and portfolio‑level insights from an ESG point of view.
Attractive Risk‑Adjusted Returns
(Fig. 1) 10‑year returns, risk‑adjusted returns, rankings
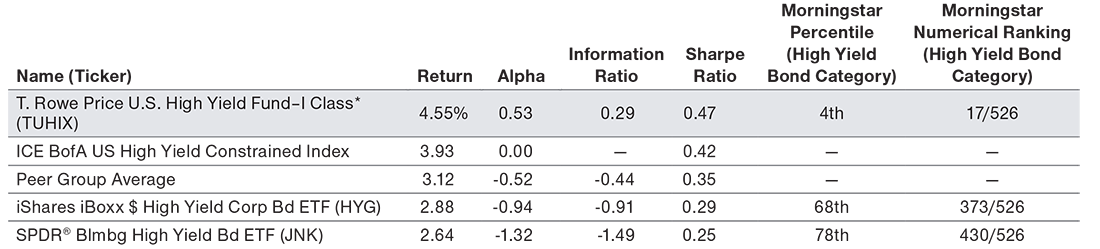
As of April 30, 2023.
Source: Morningstar Direct (see Additional Disclosures).
*The Fund commenced operations on May 19, 2017. Performance prior to that date reflects the performance of the Class I of the Predecessor Fund. Predecessor Fund performance reflects its actual operating expense at the time and was not adjusted to reflect the impact of the Fund’s current fees. Since inception returns are shown from the inception date of the Predecessor Fund, April 30, 2013.
Returns include reinvestments of dividends and capital gains if any. Returns greater than one year are annualized.
Information ratio measures a portfolio’s returns beyond the index divided by the volatility of returns.
Sharpe ratio measures a portfolio’s returns beyond the risk‑free rate divided by volatility of the excess returns.
ETF and Fund returns are at NAV.
iShares iBoxx $ High Yield Corporate Bond ETF and SPDR Bloomberg High Yield Bond ETF are the two largest passively managed high yield bond exchange‑traded funds (ETFs) as determined by assets under management as of March 31, 2023.
Performance data quoted represents past performance and is not a reliable indicator of future performance. Investment return and principal value will fluctuate so that an investor’s shares, when redeemed, may be worth more or less than their original cost. Current performance may be lower or higher than the performance data quoted. To obtain the most recent month‑end performance for the U.S. High Yield Fund, visit troweprice.com or the ETF companies’ websites for the ETFs.
See the Appendix for Standardized Performance for the fund and ETFs, which includes quarter‑end performance and rankings.
Peer group average is the average for the Morningstar High Yield Bond category. Morningstar rankings are based on cumulative total returns. For the percentile column, a lower percentile equates to a higher ranking versus other funds in the same classification or category (e.g., a percentile ranking of 25 means that the fund’s total return for that period is greater than 75% of all funds within the respective category over a given period). The ranking column shows the total number of funds in the classification or category and the numerical ranking of the U.S. High Yield Bond Fund, iShares iBoxx $ High Yield Corporate Bond ETF, and SPDR Bloomberg High Yield Bond ETF. The fund(s) may have other share classes available that offer different investment minimums and fees. See the prospectus for details.
Because new issuance is a huge component of the high yield bond market, our credit analysts review and provide a written analysis, including a proprietary credit rating and spread forecast, for every new deal. This helps us stay on top of key market developments, facilitates access to company management teams, and provides a foundation of research even for deals we did not participate in, which we can later come back to if the relative value of the investment improves.
What do you typically look for in an investment? What common qualities characterize the issuers in your portfolio?
We concentrate on finding bonds that offer attractive relative value compared with issuers in the same industry, weighing credit quality against credit spread to locate value. We focus on finding issuers that generate strong cash flows rather than just earnings growth as we think healthy cash flow is a better indicator of an issuer’s ability to meet its debt obligations in the long term. We tend to be forward‑looking when looking at issuers—often modeling a company’s financials four or five years out so that we can get a better sense of what an investment looks like over the full life of the bond—and time our investment horizon accordingly.
Enterprise value is another measure that we closely examine in order to track an issuer’s credit quality and default risk. By adding an issuer’s total debt to its equity market capitalization and subtracting any cash on its balance sheet, enterprise value not only provides an idea of the company’s value to an acquirer, but it also helps us better understand room for error. It’s worth noting that a large portion of our market consists of small private issuers where access to information can be limited. By comparing and evaluating private companies against public firms in the same industry, we can determine the size of a private issuer’s equity cushion even without readily available data. This method of measuring the amount of equity that would absorb losses before debt in an issuer bankruptcy underscores the importance of our proprietary research efforts.
We also closely examine each bond’s covenants, which define the legal agreement between the issuer and debtholders. Covenants provide legal protection for debtholders against a deterioration in the borrower’s fundamental credit metrics. We primarily rely on our own examination of covenants, though we also use some covenant research from outside providers.
In terms of bank loan analysis, we apply many of the same techniques. We look at loans as a natural extension of our investment universe and primarily consider loans of companies that also already issue bonds in our market. As we analyze a company’s overall capital structure, we will occasionally invest in loans (in vehicles that allow them) if they offer attractive relative value as a result of their higher position in the capital structure or duration4 profile.
How do you think about risk management given the fund’s concentrated approach, particularly given that defaults are an inherent part of the high yield bond asset class?
Despite taking a concentrated approach, our fund is very risk aware. We have had no defaults in our portfolio in the 10 years since the fund incepted. One of the key benefits of fewer holdings is that we can more frequently and thoroughly vet our holdings. In high yield, risks are asymmetric—our goal is to mitigate the downside while participating in the upside, in that order.
"We have had no defaults in our portfolio in the 10 years since the fund incepted."
Our approach to managing risk is dynamic and multifaceted. As you might expect, our overarching focus is on credit analysis. We have a number of different processes in place—including daily monitoring and our monthly attribution meeting—that can help provide us with early warning signs. If we detect a deteriorating trend in credit quality, we can quickly take action to reduce the size of a position or eliminate it entirely if necessary.
In periods of extreme market stress, our concentrated approach grants us the ability to go back and efficiently re‑underwrite our portfolio to regain comfort with positions or right‑size them accordingly. Our collaborative approach allows us to discuss ideas and flag key concerns with the group to solicit feedback and test each other’s thinking. We regularly take advantage of opportunities to meet with management teams, sponsors, sell‑side contacts, and our equity research counterparts to further inform our thinking.
Liquidity is another important risk management consideration. As I mentioned earlier, we actively take liquidity into account when determining the size of individual positions and are more cautious in sizing exposures that may be less liquid.
What are some of the key factors that will influence the high yield market moving forward? How do you expect the market to evolve from here?
Speaking of liquidity, it could become even more challenging in high yield going forward. We continue to feel the impact of post‑global financial crisis regulations that have caused bond dealers to hold fewer issues in their inventory, worsening the liquidity situation for many bond issues.
U.S. High Yield Fund (I Class) Morningstar Quartile Rankings*
(Fig. 2) Strong performance relative to peers*
| 1st quartile % | 82% |
| 2nd quartile % | 4% |
| 3rd quartile % | 11% |
| 4th quartile % | 4% |
As of March 31, 2023.
Performance data quoted represents past performance and is not a reliable indicator of future performance. Investment return and principal value will fluctuate so that an investor’s shares, when redeemed, may be worth more or less than their original cost. Current performance may be lower or higher than the performance data quoted. To obtain the most recent month‑end performance for the U.S. High Yield Fund, visit troweprice.com
Sources: Morningstar Direct (see Additional Disclosure), T. Rowe Price.
Results may differ significantly for different time periods.
*Percentage of observations in each quartile for rolling 3‑year periods, quarterly observations, since 6/30/13 (earliest available data for the U.S. High Yield Fund).
Morningstar rankings are based on average annual total returns. A lower quartile equates to a higher ranking versus other funds in the same classification or category (e.g., a first quartile ranking means that the fund’s total return for that period is greater than 75% of all funds within the respective category over a given period).
On a more positive note, I think that ESG will become even more important in the high yield market. In time, we could see high yield mandates that exclude holdings in the energy sector, which would be a major shift from the current high yield benchmarks and their relatively high exposure to energy. But we are not there yet.
From a structural point of view, direct private lending could eventually encroach on the high yield market. This would provide high yield companies with additional sources of funding and could hold down the level of new supply of high yield bonds, providing some technical support to the market.
What do you think is being overlooked by investors in the high yield market today? Where do you expect to see opportunities moving forward?
Many investors are focused on spreads and default rates, generally feeling anxious over what a slowdown in growth and tighter credit conditions might mean for the overall high yield market. While the fundamental backdrop is beginning to erode, corporate fundamentals have entered the current environment from a position of strength. Looking at current default forecasts, the general expectation is that defaults will rise, but only to roughly 3% by year‑end, which puts them back in line with their long‑term historical averages.5
Although most high yield issuers do not face a near‑term formidable “wall” of maturities, companies still face significant refinancing risk as interest rates have rapidly climbed. This is something that the market seems to underappreciate, but it is one of the factors that we closely monitor when analyzing credit quality.
While some investors are fixated on credit spreads, others appear to ignore them, as all‑in yields in the asset class also climbed in 2022. We think that our rigorous relative value analysis—which incorporates spreads—presents an opportunity to capture attractive yield while benefiting from our credit research. In addition, the outlook for total returns, which include both yield and price appreciation, in 2023 is much brighter than it was in early 2022 as the Fed began to tighten policy.
As an investor in this fund, what would you tell fellow investors?
We think of high yield as a strategic, long‑term investment. In our view, the best way to invest, both in the asset class and in our fund, is to stay the course—don’t jump in and out. Effectively timing the market is nearly impossible, and staying invested gives you the opportunity to benefit from our goal of outperforming over the full credit cycle. Though we won’t outperform every single quarter, and inevitably we will make some mistakes, over the long term, our time‑tested approach has enabled us to provide strong performance compared to the benchmark.
"In our view, the best way to invest, both in the asset class and in our fund, is to stay the course—don’t jump in and out."
Appendix
Standardized Performance
(Fig. A1) Total returns and Morningstar rankings through periods ended March 31, 2023
| iShares iBoxx $ High Yield Corp Bd ETF | SPDR® Blmbg High Yield Bd ETF | T. Rowe Price U.S. High Yield Fund–I Class | ||
|---|---|---|---|---|
| Ticker | HYG | JNK | TUHIX | |
| 10 Year (4/1/2013–3/31/2023) | Return (annualized) | 3.00% | 2.74% | 4.41* |
| Morningstar High Yield Bond category rank | 361 | 429 | 20* | |
| Morningstar High Yield Bond category percentile | 67 | 79 | 4* | |
| # of investments ranked in Morningstar High Yield Bond category | 525 | 525 | 528* | |
| Five Year (4/1/2018–3/31/2023) | Return (annualized) | 2.41% | 2.27% | 2.43% |
| Morningstar High Yield Bond category rank | 343 | 388 | 331 | |
| Morningstar High Yield Bond category percentile | 60 | 66 | 58 | |
| # of investments ranked in Morningstar High Yield Bond category | 614 | 614 | 614 | |
| One Year (4/1/2022–3/31/2023) | Return (cumulative) | ‑3.93% | ‑4.78% | ‑7.27% |
| Morningstar High Yield Bond category percentile | 59 | 75 | 96 | |
| Morningstar High Yield Bond category rank | 391 | 502 | 656 | |
| # of investments ranked in Morningstar High Yield Bond category | 682 | 682 | 682 | |
Performance data quoted represents past performance and is not a reliable indicator of future performance. Investment return and principal value will fluctuate so that an investor’s shares, when redeemed, may be worth more or less than their original cost. Current performance may be lower or higher than the performance data quoted. To obtain the most recent month‑end performance for the U.S. High Yield Fund, visit troweprice.com or the ETF companies’ websites for the ETFs.
Morningstar rankings are based on cumulative total returns. For the percentile row, a lower percentile equates to a higher ranking versus other funds in the same classification or category (e.g., a percentile ranking of 25 means that the fund’s total return for that period is greater than 75% of all funds within the respective category over a given period.) The ranking row shows the total number of funds in the classification or category and the numerical ranking of the U.S. High Yield Fund, iShares iBoxx $ High Yield Corporate Bond ETF, and SPDR Bloomberg High Yield Bond ETF.
ETF and Fund returns are at NAV.
The US High Yield Fund commenced operations on May 19, 2017. Performance prior to that date reflects the performance of the Class I of the Predecessor Fund.
Predecessor Fund performance reflects its actual operating expense at the time and was not adjusted to reflect the impact of the Fund’s current fees. Since inception returns are shown from the inception date of the Predecessor Fund, April 30, 2013.
Returns include reinvestments of dividends and capital gains if any. Returns greater than one year are annualized.
The fund(s) may have other share classes available that offer different investment minimums and fees. See the prospectus for details.
*Time period is from fund inception on 4/30/2013 through 3/31/2023.
Performance Details
(Fig. A2) Standard Performance Periods
| Total Return (%) as of March 31, 2023 | 1 Year | 3 Years | 5 Years | 10 Years |
|---|---|---|---|---|
| iShares iBoxx $ High Yield Corp Bd ETF (NAV Return) | ‑3.93 | 4.12 | 2.41 | 3.00 |
| iShares iBoxx $ High Yield Corp Bd ETF (Market Price Return) | ‑3.09 | 4.22 | 2.48 | 3.03 |
| Markit iBoxx USD Liquid High Yield Index | ‑3.25 | 4.76 | 2.92 | 3.49 |
| SPDR® Blmbg High Yield Bd ETF (NAV Return) | ‑4.78 | 4.32 | 2.27 | 2.74 |
| SPDR® Blmbg High Yield Bd ETF (Market Price Return) | ‑3.79 | 4.61 | 2.42 | 2.80 |
| Bloomberg High Yield Very Liquid Index | ‑3.89 | 4.90 | 2.85 | 3.62 |
Market returns are based on the midpoint of the bid/ask spread at 4 p.m. ET and do not represent the returns an investor would receive if shares were traded at other times. Performance data quoted represents past performance and is not a reliable indicator of future performance. Investment return and principal value will fluctuate so that an investor’s shares, when sold, may be worth more or less than their original cost. Current performance may be lower or higher than the performance data quoted. To obtain the most recent month‑end performance, visit the ETF companies’ websites. Fund performance reflects applicable fee waivers, without which performance data quoted would have been lower.
Source for returns: Morningstar (see Additional Disclosures).
Returns include reinvestments of dividends and capital gains. Returns greater than one year are annualized. There are difference between open‑ended mutual funds that are actively managed and exchange‑traded funds that are passively managed that impact performance. These differences include, but are not limited to, investment objectives, trading, pricing, investment strategy, tax implications, fees, expenses and trading costs, and transparency. These differences should be carefully considered when making investment decisions. All investments involve risk, including possible loss of principal. When valuations fall and market and economic conditions change, it is possible for both actively and passively managed investments to lose value.
Fixed income securities are subject to credit risk, inflation risk, liquidity risk, call risk, and interest rate risk. As interest rates rise, bond prices generally fall. Although actively managed mutual funds have the potential to outperform an index, this is not guaranteed, and they may trail the index.
Index performance does not reflect the expenses of managing a portfolio as an index is unmanaged and not available for direct investment.
For more information about the ETFs, visit the fund companies’ websites.
Fund Description and Investment Objective
(Fig. A3) Portfolio characteristics as of March 31, 2023
| Fund Name | Type | Inception | AUM (USD) | Gross Expense Ratio (%) | Investment Objective |
|---|---|---|---|---|---|
| T. Rowe Price US High Yield Fund–I Class (TUHIX)* | Mutual Fund | 4/30/2013 | 416 Million | 0.65 | The fund seeks total return, and secondarily, current income |
| iShares iBoxx $ High Yield Corp Bd ETF (HYG) | ETF | 4/4/2007 | 12.5 Billion | 0.48 | The investment seeks to track the investment results of the Markit iBoxx® USD Liquid High Yield Index |
| SPDR Blmbg High Yield Bd ETF (JNK) | ETF | 11/28/2007 | 6.9 Billion | 0.40 | The investment seeks to track the performance of the Bloomberg High Yield Very Liquid Index |
*TUHIX has an investment minimum of $500,000.
There are difference between open‑ended mutual funds that are actively managed and exchange‑traded funds that are passively managed that impact performance.
These differences include, but are not limited to, investment objectives, trading, pricing, investment strategy, tax implications, fees, expenses and trading costs, and transparency. These differences should be carefully considered when making investment decisions.
All investments involve risk, including possible loss of principal. When valuations fall and market and economic conditions change, it is possible for both actively and passively managed investments to lose value.
Fixed income securities are subject to credit risk, inflation risk, liquidity risk, call risk, and interest rate risk. As interest rates rise, bond prices generally fall. Investments in high‑yield bonds involve greater risk of price volatility, illiquidity, and default than higher‑rated debt securities.
Investments in bank loans may at times become difficult to value and highly illiquid; they are subject to credit risk such as nonpayment of principal or interest, and risks of bankruptcy and insolvency.
Although actively managed mutual funds have the potential to outperform an index, this is not guaranteed, and they may trail the index.
Index performance does not reflect the expenses of managing a portfolio as an index is unmanaged and not available for direct investment.
For more information about the ETFs, visit the fund companies’ websites. The US High Yield Fund commenced operations on May 19, 2017. Performance prior to that date reflects the performance of the Class I of the Predecessor Fund. Predecessor Fund performance reflects its actual operating expense at the time and was not adjusted to reflect the impact of the Fund’s current fees. Since inception returns are shown from the inception date of the Predecessor Fund, April 30, 2013.
-
1 Performance data quoted represents past performance and does not guarantee future results. Investment return and principal value will fluctuate so that an investor’s shares, when redeemed, may be worth more or less than their original cost. Current performance may be lower or higher than the performance data quoted. To obtain the most recent month‑end performance, visit troweprice.com. See Standardized Performance table in the Appendix, which includes quarter‑end annualized performance data and rankings information. The T. Rowe Price US High Yield Fund (“Fund”) commenced operations on May 19, 2017. At that time, the Fund received all of the assets and liabilities of the Henderson High Yield Opportunities Fund (the “Predecessor Fund”) and adopted its performance and accounting history. The Fund and the Predecessor Fund have substantially similar investment objectives and strategies. The Predecessor Fund was managed by the same portfolio manager as the Fund.
2 Alpha is the excess return of an investment relative to its benchmark.
3 Credit spreads measure the additional yield that investors demand for holding a bond with credit risk over a similar‑maturity, high‑quality government security.
4 Duration measures a bond’s or bank loan’s sensitivity to changes in interest rates.
5 Actual outcomes may differ materially from estimates and forward‑looking statements made, which are subject to limitations. For any historical data taken into account, past results are not a reliable indicator future results.
Additional Disclosures
©2023 Morningstar, Inc. All rights reserved. The information contained herein: (1) is proprietary to Morningstar and/or its content providers; (2) may not be copied or distributed; and (3) is not warranted to be accurate, complete, or timely. Neither Morningstar nor its content providers are responsible for any damages or losses arising from any use of this information. Past performance is no guarantee of future results.
CFA® and Chartered Financial Analyst® are registered trademarks owned by CFA Institute.
-
Important Information
Call 1‑800‑225‑5132 to request a prospectus or summary prospectus; each includes investment objectives, risks, fees, expenses, and other information you should read and consider carefully before investing.
U.S. High Yield Fund Risks: All investments are subject to risk, including the possible loss of principal. Fixed‑income securities are subject to credit risk (high‑yield bonds carry a greater default risk than higher‑rated bonds), liquidity risk, call risk, and interest‑rate risk. Yield and share price will vary with interest rate changes.
This material is provided for informational purposes only and is not intended to be investment advice or a recommendation to take any particular investment action.
The views contained herein are those of the authors as of May 2023 and are subject to change without notice; these views may differ from those of other T. Rowe Price associates.
This information is not intended to reflect a current or past recommendation concerning investments, investment strategies, or account types, advice of any kind, or a solicitation of an offer to buy or sell any securities or investment services. The opinions and commentary provided do not take into account the investment objectives or financial situation of any particular investor or class of investor. Please consider your own circumstances before making an investment decision.
Information contained herein is based upon sources we consider to be reliable; we do not, however, guarantee its accuracy.
Past performance is not a reliable indicator of future performance. All investments are subject to market risk, including the possible loss of principal. All charts and tables are shown for illustrative purposes only.
T. Rowe Price Investment Services, Inc. For Institutional Investors Only.
© 2023 T. Rowe Price. All rights reserved. T. ROWE PRICE, INVEST WITH CONFIDENCE, and the bighorn sheep design are, collectively and/or apart, trademarks or registered trademarks of T. Rowe Price Group, Inc.
202305-2913833
Get the full story.
We’re ready to share our latest thinking, but industry regulations require you to register or sign in to continue reading this article. Thank you for understanding.
Just one more step.
To continue, you are required to read and accept our Terms & Conditions. Thank you for understanding.
1 Performance data quoted represents past performance and does not guarantee future results. Investment return and principal value will fluctuate so that an investor’s shares, when redeemed, may be worth more or less than their original cost. Current performance may be lower or higher than the performance data quoted. To obtain the most recent month‑end performance, visit troweprice.com. See Standardized Performance table in the Appendix, which includes quarter‑end annualized performance data and rankings information. The T. Rowe Price US High Yield Fund (“Fund”) commenced operations on May 19, 2017. At that time, the Fund received all of the assets and liabilities of the Henderson High Yield Opportunities Fund (the “Predecessor Fund”) and adopted its performance and accounting history. The Fund and the Predecessor Fund have substantially similar investment objectives and strategies. The Predecessor Fund was managed by the same portfolio manager as the Fund.
Important Information
U.S. High Yield Fund Risks: All investments are subject to risk, including the possible loss of principal. Fixed‑income securities are subject to credit risk (high‑yield bonds carry a greater default risk than higher‑rated bonds), liquidity risk, call risk, and interest‑rate risk. Yield and share price will vary with interest rate changes.
This material is provided for informational purposes only and is not intended to be investment advice or a recommendation to take any particular investment action.
The views contained herein are those of the authors as of May 2023 and are subject to change without notice; these views may differ from those of other T. Rowe Price associates.
This information is not intended to reflect a current or past recommendation concerning investments, investment strategies, or account types, advice of any kind, or a solicitation of an offer to buy or sell any securities or investment services. The opinions and commentary provided do not take into account the investment objectives or financial situation of any particular investor or class of investor. Please consider your own circumstances before making an investment decision.
Information contained herein is based upon sources we consider to be reliable; we do not, however, guarantee its accuracy.
Past performance is not a reliable indicator of future performance. All investments are subject to market risk, including the possible loss of principal. All charts and tables are shown for illustrative purposes only.
T. Rowe Price Investment Services, Inc. For Institutional Investors Only.
© 2023 T. Rowe Price. All rights reserved. T. ROWE PRICE, INVEST WITH CONFIDENCE, and the bighorn sheep design are, collectively and/or apart, trademarks or registered trademarks of T. Rowe Price Group, Inc.
202305-2913826