


Market Review
- Global Markets Quarterly Update
- Third Quarter 2022
- Key Insights
-
- Global markets pulled back further as interest rates rose in response to the Federal Reserve’s aggressive monetary tightening.
- Inflation in the eurozone accelerated to a record 10.1% amid signs of a deepening economic downturn.
- The U.S. dollar rose sharply against nearly all major currencies, further weighing on returns for U.S. investors in overseas markets.
GET INSIGHTS FROM OUR EXPERTS
Receive timely market data and analysis to share with your clients.
Stocks rallied early but retraced their gains to close out a third consecutive quarter of negative returns; from its August 16 high to September 30, the S&P 500 Index declined nearly 17%. After outperforming earlier in the year, value stocks performed worse than growth stocks, according to Russell indexes. Small-cap growth shares performed best and were roughly flat for the period. Sector performance varied widely within the S&P 500, with communication services stocks declining nearly 13% on a total return (including dividends) basis, while consumer discretionary shares gained over 4%.
Bond prices also fell sharply as Federal Reserve officials expressed their resolve to raise interest rates as much as necessary to keep inflation under control. The yield on the benchmark 10-year U.S. Treasury note hit its highest level since 2008, while the two-year U.S. Treasury note yield reached its highest point since 2007. Policymakers raised the target federal funds rate twice in the quarter by a total of 150 basis points (1.50 percentage points), continuing one of their most aggressive hiking programs in decades.
Consumer and Producer Prices Fall Back Early in the Quarter...
The quarter began on a note of optimism as signs emerged that the Fed was making progress in tamping down inflation without causing too much harm to the economy. Headline consumer prices stayed steady in July, and the year-over-year increase slipped to 8.5% from June’s reading of 9.1%. The year-over-year increase in the producer price index fell from 11.3% in June to 9.8% in July, registering the first pullback in the headline number since April 2020.
Gauges activity in the manufacturing and services sectors offered conflicting signals, but they arguably demonstrated surprising resilience in the face of rising rates. Retail sales also surprised on the upside, and surveys showed improvement in consumer confidence and sentiment. Markets rallied in early August after the Labor Department reported that employers had added 528,000 nonfarm jobs in July, more than double consensus expectations of around 250,000, while May and June estimates were revised upward. The unemployment rate fell to 3.5%, matching its February 2020 level.
…But Hopes for Having Moved Past “Peak Inflation” Soon Fade
Hopes that “peak inflation” would result in a “soft landing” appeared to evaporate in the middle of the quarter, however. St. Louis Fed President James Bullard told The Wall Street Journal on August 18 that “the idea that inflation has peaked is…not statistically really in the data at this point.” Other officials soon echoed his comments, and Fed Chair Jerome Powell acknowledged that “no one knows whether this process [of raising rates] will lead to a recession, and if so, how significant that recession would be.”
While economists stressed that the Fed’s rate hikes would take time to work their way through the economy, their impact already seemed clear in the housing sector. As mortgage rates drifted near 7% for the first time since the housing boom of the 2000s, the Case-Shiller Home Price Index recorded its first monthly decline since early 2012, while prices decelerated on a year-over-year basis from June to July at the fastest pace in the history of the index.
Finally, some inflation measures took an unwelcome turn back upward late in the quarter, further weighing on sentiment. In particular, core inflation (excluding food and energy) jumped to 6.3% for the 12 months ended in August—its highest level since March and above consensus expectations. On a positive note, the summer’s steep decline in gasoline prices appeared to help lower consumers’ five-year inflation expectations to 2.7%, the lowest reading in over a year. Fed officials have repeatedly stressed the importance of long-term inflation expectations remaining “anchored.”
In local currency terms, the pan-European STOXX Europe 600 Index ended sharply lower amid heightened fears that central banks’ attempts to stamp out inflation and energy rationing might push their economies into recession. Major indexes in Germany, Italy, France, and the UK also dropped. Surging energy costs also weighed on markets, as Russia halted already curtailed natural gas exports to Europe at the end of August. The euro sank to below parity with the U.S. dollar.
European Central Bank Raises Interest Rates
The European Central Bank (ECB) increased its key interest rates by a record 0.75 of a percentage point in September in a bid to curb inflation. The deposit rate now stands at 0.75% and the refinancing rate at 1.25%—their highest levels since 2011. “This major step frontloads the transition from the prevailing highly accommodative level of policy rates towards levels that will ensure the timely return of inflation to the ECB’s 2% medium-term target,” the ECB explained in its official statement. Even so, the central bank indicated that more rate increases are likely. Central banks in Norway, Sweden, Switzerland, and the UK followed with meaningful rate increases as well.
Eurozone Inflation Hits Record, PMIs Show Deeper Slowdown; UK Avoids Recession
Inflation in the eurozone accelerated to a record 10.1% in September from 9.1% the previous month, exceeding expectations. Meanwhile, eurozone economic growth in the second quarter was revised up to 0.8% sequentially amid a recovery in household spending. But purchasing managers’ index (PMI) surveys indicated that business activity contracted for a third consecutive month in September amid signs of a deepening economic downturn.
In the UK, revised data unexpectedly showed that the economy avoided a recession in the three months through June. Gross domestic product (GDP) increased by 0.2% instead of shrinking 0.1% as previously estimated. Even so, consumer and business confidence slumped to record lows in subsequent months as surging energy costs and high inflation squeezed disposable income.
BoE Intervenes After New UK Fiscal Plan Sparks Asset Slide
A new UK fiscal plan proposing large tax cuts, energy subsidies, and sizable borrowing triggered turmoil in UK financial markets at the end of the quarter, prompting the Bank of England (BoE) to intervene to support the sovereign bond (gilts) market. BoE Chief Economist Huw Pill indicated that the policy and adverse market reaction “will require a significant monetary response” in November. Earlier, the International Monetary Fund called on the UK to “reevaluate” the plan to ensure that fiscal and monetary policy aren’t working at cross purposes.
Russia Intensifies Energy Squeeze on Europe
Russia’s state-owned energy company Gazprom halted supplies of natural gas to Europe via the Nord Stream 1 pipeline at the end of August and reduced deliveries to France-based utility Engie over a contract dispute. Russia exacerbated the energy crisis by halting supplies to Italy via Austria at the end of September. Storage levels of natural gas for winter reached maximum capacity in France in September, almost 92% in Germany, and 83% in Italy, officials said.
New Prime Minister in UK; Italy Votes for Right-Wing Government
The ruling UK Conservative party voted to replace Prime Minister Boris Johnson with Liz Truss, the foreign secretary. In Italy, a coalition of right-wing parties led by Giorgia Meloni’s ultraconservative Brothers of Italy party won the general election, as was widely expected.
Japanese shares finished the quarter lower than where they began. The Nikkei 225 Index declined 1.73% to close at 25,937, its lowest level since July 1, while the broader TOPIX finished 1.86% lower, ending the period at 1,836.
The first two months proved supportive of Japanese equities, as risk appetite was boosted by tentative expectations that the U.S. Federal Reserve may need to slow the pace of its interest rate hikes. However, toward the end of August, the U.S. Fed made clear its hawkish intentions. This led to renewed worries that central bank tightening might lead to a global recession. The divergence between Japanese monetary policy and that of other major markets was also a growing source of worry as the quarter progressed.
Government Intervenes to Support Yen
The Bank of Japan’s (BoJ) ongoing dovish stance was a key influence on the further weakening of the yen against the U.S. dollar during the quarter. The progressive weakening that has been a feature for much of this year reached crisis levels in September, forcing the government to intervene in the currency market for the first time in 24 years after the yen fell below JPY 145 versus the U.S. dollar.
The desired strengthening effect proved temporary, however. The BoJ’s monetary policy meeting minutes released in September showed policymakers voted 8–1 to maintain a benchmark interest rate of -0.1%. The central bank also confirmed that it will continue to purchase a necessary amount of Japanese government bonds without setting an upper limit, in order to keep 10-year yields around 0%. This saw the currency weaken once more, finishing in the mid-to-high JPY 144 range versus the dollar.
In August, benchmark government bond yields fell to their lowest level since March. The key 10-year yield fell to 0.160%, with the BoJ’s ultralow interest rate stance, contrary to other major central banks, a key factor. However, yields moved higher into the quarter-end, ultimately finishing around 0.247%, close to the BoJ’s upper limit of 0.250%.
Inflation Accelerates to Eight-Year High
Data released in September indicated that Japan’s core consumer price inflation, which excludes volatile food prices, accelerated to a year-over-year rate of 2.8% in August, the fastest increase since October 2014. The reading exceeded forecasts for an increase of 2.7% and was up from 2.4% in July.
Other economic news was broadly encouraging, although some signs of slowing activity were evident. Japan’s GDP expanded by a seasonally adjusted annualized rate of 2.2% in the second quarter. This missed consensus expectations of around 2.5% growth but was up on 0.1% growth in the first quarter. In a separate report, Japan’s manufacturing sector continued to expand, albeit at a slower pace. Industrial production and retail sales figures for August also provided encouragement, with both readings beating expectations. Finally, Japan’s jobless rate fell to 2.5% in August, while the availability of jobs grew for the eighth straight month to a more than two-year high.
Chinese stock markets slumped in the third quarter as intermittent coronavirus lockdowns, weak economic indicators, and an ongoing property slump weighed on the country’s near-term outlook. The MSCI China Index slid 22.44% and the MSCI A Onshore Index fell 18.96% in U.S. dollar terms, underperforming the broader emerging markets and developed markets benchmarks.
The yield on the 10-year Chinese government bond ended the quarter at 2.776%, up sharply from a low of 2.639% struck in September, as the Fed’s hawkish stance dampened the relative attractiveness of lower-yielding Chinese bonds. In currency trading, the yuan dropped 5.6% against the U.S. dollar, weighed by slowing growth concerns and aggressive rate hikes in the U.S. The Chinese currency hit a 28-month low versus the dollar in late September and is down about 10% against the greenback this year.
Economic data suggested that China’s economy was stalling. The Caixin/Markit manufacturing PMI fell to a worse-than-expected 48.1 in September from 49.5 in August, below the 50-point reading that separates growth from contraction. Meanwhile, China’s official manufacturing PMI slightly improved in September, but services sector activity contracted as nationwide coronavirus lockdowns hurt consumer spending. August readings for industrial production, retail sales, and fixed asset investment beat estimates. However, other indicators showed that the property sector remained mired in a downturn, with home sales and prices both down from year-ago levels.
In a worrying development for the government, tens of thousands of Chinese homebuyers stopped making mortgage payments on incomplete homes out of fear that cash-strapped developers have run out of funding to finish their projects. The fast-growing mortgage boycott that started in June has raised concerns about financial contagion spreading from China’s debt-laden property sector to the country’s banks. In response, regulators asked lenders to provide credit to certain developers so they can complete their projects. S&P Global Ratings estimates that nationwide property sales could fall up to 33% this year, an outcome that could trigger more defaults among developers and steep mortgage losses for Chinese banks.
Earlier this year, Beijing set an annual growth target of about 5.5%, a level that many analysts believe is out of reach due to mounting headwinds on the economy. During the quarter, a growing number of economists downgraded their growth forecasts for China. In September, the Asian Development Bank reduced its China growth estimate to 3.3% this year from a prior 4.0% estimate. The bank also forecast that China’s economic growth would lag that of developing Asia for the first time in more than three decades.
Turkish Stocks Trounce Broad Emerging Markets
Turkish stocks, as measured by MSCI, returned 16.32% in U.S. dollar terms versus -11.42% for the MSCI Emerging Markets Index. The market’s performance in local currency terms was even stronger, but returns to U.S. investors were reduced by the lira’s 10% drop versus the greenback.
On August 18, Turkey’s central bank unexpectedly reduced its key interest rate, the one-week repo auction rate, from 14.0% to 13.0%. The rate had been at 14.0% since mid-December 2021. According to the post-meeting statement, policymakers justified the rate cut by indicating that they expect the “disinflation process to start on the back of measures taken and decisively implemented for strengthening sustainable price and financial stability.” Policymakers also claimed that “leading indicators for the third quarter point to some loss of momentum in economic activity” and that it is “important that financial conditions remain supportive to preserve the growth momentum in industrial production and the positive trend in employment.” About one month later, on September 22, the central bank reduced the one-week repo rate again, from 13.0% to 12.0%, and justified its decision with virtually the same language.
With headline consumer price index inflation at a year-over-year rate of about 80%, and with corporations lobbying for the ability to adjust or revise their financial statements to reflect the elevated inflation environment, T. Rowe Price sovereign analyst Peter Botoucharov believes that these rate cuts confirm the central bank’s support for President Recep Tayyip Erdogan’s “new economic program”—at least until the June 2023 presidential and legislative elections. The program, which is based on highly stimulative monetary policy and credit support, is intended to increase the competitiveness of Turkish exporters in world markets and lead to stronger economic growth and job creation. The downside of these policies, however, is higher inflation and a depreciating currency.
Colombian Stocks Plummet
Stocks in Colombia, as measured by MSCI, returned -18.31% in the third quarter versus -11.42% for the MSCI Emerging Markets Index. Returns to U.S. investors were hurt by the peso’s 9% drop versus the U.S. dollar.
On August 7, Gustavo Petro was sworn into office as the country’s first leftist president. In his inaugural speech, he focused on themes such as social equality, inclusion, and the environment. He highlighted several parts of the economy and society in which he intends to pursue reforms, including taxes, pensions, labor, and education. However, he did acknowledge that the changes would be fair and not confiscatory. He also said he would comply with and enforce the constitution.
The new Petro administration wasted no time in unveiling its tax reform proposal. According to T. Rowe Price sovereign analyst Aaron Gifford, the proposal aims to increase government revenues by 1.7% of GDP in 2023 and 1.4% over the medium term through a higher tax burden on higher-net-worth individuals, a reduction of corporate exemptions, and new taxes on hydrocarbons and mining exports above certain commodity price thresholds.
While the proposal, if implemented, would increase government revenues, Gifford notes that this is much less than the 4% of GDP that Petro had previously talked about. Gifford is also concerned about the potential for unexpected consequences from tax reform (such as wealthy individuals taking their assets offshore) or export taxes adding stress to the already wide current account deficit. Although President Petro has working majorities in both houses of Congress—which increases the likelihood of tax reform becoming law—Gifford would not be surprised to see some watering down of the reform proposal before passage.
Major Index Returns
Total returns unless noted
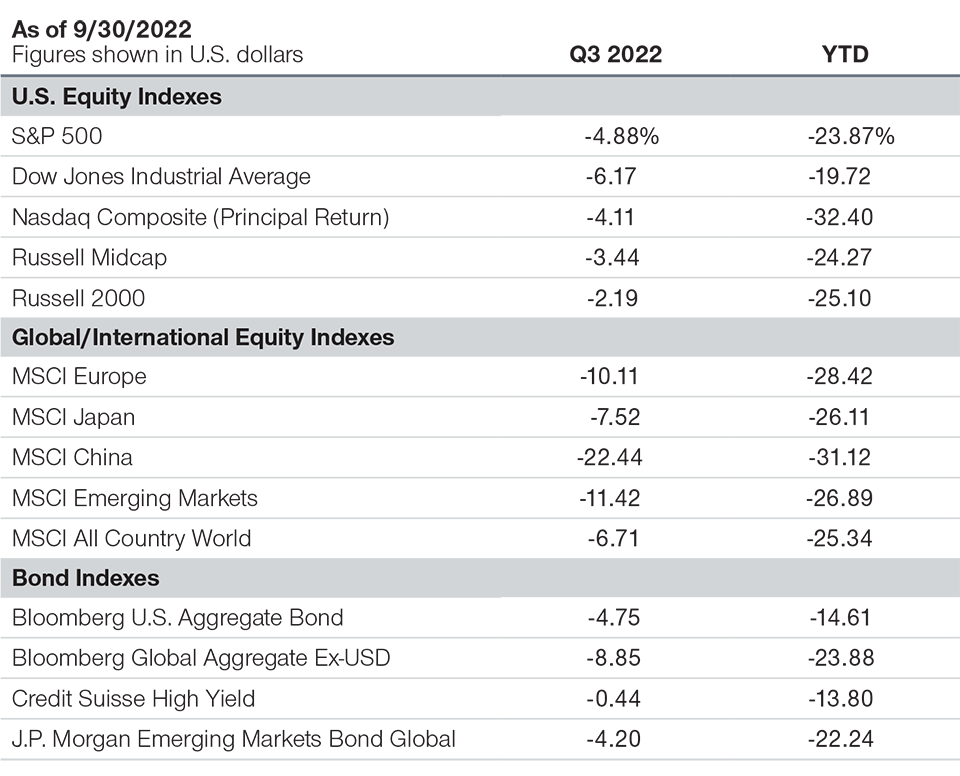
Past performance is not a reliable indicator of future performance.
Note: Returns are for the periods ended September 30, 2022. The returns include dividends and interest income based on data supplied by third‑party provider RIMES and compiled by T. Rowe Price, except for the Nasdaq Composite Index, whose return is principal only.
Sources: Standard & Poor’s, LSE Group, Bloomberg Index Services Limited, MSCI, Credit Suisse, Dow Jones, and J.P. Morgan (see Additional Disclosures).
Many economic signals are currently flashing red and have been accurate recession warnings in the past. Among them: global manufacturing activity (as measured by PMIs) is falling fast, stock market returns have tumbled over the past year, and the inverted Treasury yield curve shows that long-term growth and inflation expectations are waning as the Fed raises short-term rates. I’m not confident that we’ve seen the last of the bad news. For example, I’m concerned about the potential for yet another rate shock if Japan abandons its effort to keep long-term interest rates near zero.
If a recession is coming, however, it’s likely to be an unusual one. I also see green lights—some of which are flashing a very bright green indeed. Over the last few months, the economy has created about two to three times the number of jobs as compared with the pre-pandemic average. Economists are struggling with historical comparisons because we’ve never had such an extraordinary level of openings with unemployment this low (3.7% in August)—a prime example of a COVID distortion.
Several other signals are also flashing green. U.S. manufacturing activity (PMI levels), earnings surprises, nominal consumption growth, and leverage, while trending negative, aren’t anywhere near historical pre-recession levels. On balance, however, I believe the red signals outweigh the green ones, and that we are eventually headed for a mild to moderate recession.
In some asset classes—high yield bonds and small-cap stocks, namely—I think valuations are discounting a deep and imminent recession, which I find less likely. By our calculation, high yield spreads are high relative to our estimate of the equity risk premium (using trailing 10-year data)1. Moreover, asset flows and positioning are extremely negative on high yield, which may mean that investors are underestimating the sector’s potential. Equally important, the sector is higher quality than it used to be in terms of ratings distributions within the Credit Suisse High Yield Index. Default risk has remained low based on strong balance sheets and debt coverage ratios. Further adding to the sector’s appeal, we think our active management can reduce exposure to defaults.
The story is similar for small-caps. Based on the S&P SmallCap 600 Index—which excludes companies without positive earnings—the asset class is historically cheap. The earnings yield on the S&P SmallCap 600 versus the Russell 1000 Index is the highest it’s been in more than 20 years. Given current pricing, they seem to have similar downside risk as the market overall, with more upside potential, should we get anything but a deep recession.
In short, I’ll acknowledge that the outlook is clouded, but it’s probably a good sign that the mood on Wall Street is so dour. I can’t recall a time when sentiment was as universally negative. If we get a recession, it will likely be one that virtually everyone saw coming. Opportunities may be on the horizon for patient and long-term investors who are willing to lean against the wind.
THE IN-DEPTH MARKET DETAILS YOU NEED
Subscribe to regular email updates and inform your client conversations.
-
1 This indicates that potential compensation from credit spreads, which measure the additional yield that investors demand for holding a bond with credit risk over a similar‑maturity, high‑quality government security, may currently be more similar to the potential compensation for taking on equity risk.
Past performance is not a reliable indicator of future performance.
-
The specific securities identified and described are for informational purposes only and do not represent recommendations.
Additional Disclosures
The S&P 500 Index is a product of S&P Dow Jones Indices LLC, a division of S&P Global, or its affiliates (“SPDJI”) and has been licensed for use by T. Rowe Price. Standard & Poor’s® and S&P® are registered trademarks of Standard & Poor’s Financial Services LLC, a division of S&P Global (“S&P”); Dow Jones® is a registered trademark of Dow Jones Trademark Holdings LLC (“Dow Jones”); T. Rowe Price is not sponsored, endorsed, sold or promoted by SPDJI, Dow Jones, S&P, their respective affiliates, and none of such parties make any representation regarding the advisability of investing in such product(s) nor do they have any liability for any errors, omissions, or interruptions of the S&P 500 Index.
London Stock Exchange Group plc and its group undertakings (collectively, the “LSE Group”). © LSE Group 2022. FTSE Russell is a trading name of certain of the LSE Group companies. “Russell®” is a trade mark(s) of the relevant LSE Group companies and is used by any other LSE Group company under license. All rights in the FTSE Russell indexes or data vest in the relevant LSE Group company which owns the index or the data. Neither LSE Group nor its licensors accept any liability for any errors or omissions in the indexes or data and no party may rely on any indexes or data contained in this communication. No further distribution of data from the LSE Group is permitted without the relevant LSE Group company’s express written consent. The LSE Group does not promote, sponsor or endorse the content of this communication. The LSE Group is not responsible for the formatting or configuration of this material or for any inaccuracy in T. Rowe Price Associates’ presentation thereof.
MSCI and its affiliates and third party sources and providers (collectively, “MSCI”) makes no express or implied warranties or representations and shall have no liability whatsoever with respect to any MSCI data contained herein. The MSCI data may not be further redistributed or used as a basis for other indices or any securities or financial products. This report is not approved, reviewed, or produced by MSCI. Historical MSCI data and analysis should not be taken as an indication or guarantee of any future performance analysis, forecast or prediction. None of the MSCI data is intended to constitute investment advice or a recommendation to make (or refrain from making) any kind of investment decision and may not be relied on as such.
“Bloomberg®” and Bloomberg U.S. Aggregate Bond, Bloomberg Global Aggregate Ex‑USD are service marks of Bloomberg Finance L.P. and its affiliates, including Bloomberg Index Services Limited (“BISL”), the administrator of the index (collectively, “Bloomberg”) and have been licensed for use for certain purposes by T. Rowe Price. Bloomberg is not affiliated with T. Rowe Price, and Bloomberg does not approve, endorse, review, or recommend its products. Bloomberg does not guarantee the timeliness, accurateness, or completeness of any data or information relating to its products.
© 2022 CREDIT SUISSE GROUP AG and/or its affiliates. All rights reserved.
Information has been obtained from sources believed to be reliable but J.P. Morgan does not warrant its completeness or accuracy. The index is used with permission. The Index may not be copied, used, or distributed without J.P. Morgan’s prior written approval. Copyright © 2022, J.P. Morgan Chase & Co. All rights reserved.
Important Information
This material is provided for informational purposes only and is not intended to be investment advice or a recommendation to take any particular investment action.
The views contained herein are as of the date written and are subject to change without notice; these views may differ from those of other T. Rowe Price associates.
This information is not intended to reflect a current or past recommendation concerning investments, investment strategies, or account types, advice of any kind, or a solicitation of an offer to buy or sell any securities or investment services. The opinions and commentary provided do not take into account the investment objectives or financial situation of any particular investor or class of investor. Please consider your own circumstances before making an investment decision.
Information contained herein is based upon sources we consider to be reliable; we do not, however, guarantee its accuracy.
Past performance is not a reliable indicator of future performance. Actual outcomes may differ materially from any estimates or forward-looking statements made. All investments are subject to market risk, including the possible loss of principal. Fixed-income securities are subject to credit risk, liquidity risk, call risk, and interest-rate risk. As interest rates rise, bond prices generally fall. Investments in high-yield bonds involve greater risk of price volatility, illiquidity, and default than higher-rated debt securities. Small-cap stocks have generally been more volatile in price than the large-cap stocks. All charts and tables are shown for illustrative purposes only.
T. Rowe Price Investment Services, Inc., distributor, and T. Rowe Price Associates, Inc., investment adviser.
© 2022 T. Rowe Price. All rights reserved. T. ROWE PRICE, INVEST WITH CONFIDENCE, and the bighorn sheep design are, collectively and/or apart, trademarks or registered trademarks of T. Rowe Price Group, Inc.
202210-2476507