


Market Review
- Global Markets Quarterly Update
- Second Quarter 2022
- Key Insights
-
- Global equity markets suffered their biggest declines since the start of the pandemic, as fears grew that central banks will push economies into recession in their fight against inflation.
- Inflation pressures remained elevated, particularly in Europe, as cuts in oil and gas imports pushed up energy costs.
- China’s market was an outlier, rallying as easing lockdown measures helped boost economic growth.
GET INSIGHTS FROM OUR EXPERTS
Receive timely market data and analysis to share with your clients.
Stocks fell sharply as the Federal Reserve aggressively raised interest rates to curb the highest inflation in four decades. The S&P 500 Index endured its worst quarterly decline since the start of the pandemic and entered a bear market, ending June down more than 21% from its January peak. As was widely reported, the quarter rounded out the index’s worst first half of a calendar year since 1970, a decline amplified by the index hitting its all-time high on January 3.
Higher interest rates caused investors to place less value on a company’s future earnings, punishing high-growth stocks in particular. Several mega-cap technology and internet-related stocks pulled back sharply, which was reflected in the notable underperformance of the Nasdaq Composite Index. Within the S&P 500, typically defensive shares, such as utilities, health care, and consumer staples, held up best. Energy stocks surrendered part of their strong first-quarter gains as oil prices retreated from record highs but remained the best-performing sector for the year to date.
Fed Makes Most Aggressive Tightening Moves in Three Decades
Inflation and interest rate worries also punished bond investors. The Federal Reserve raised official short-term interest rates by a total of 125 basis points (1.25 percentage points) in the quarter, its most aggressive move in nearly three decades. Longer-term bond yields also increased considerably, with the yield on the benchmark 10-year U.S. Treasury note touching 3.49% on June 14, its highest level in more than a decade. (Bond prices and yields move in opposite directions.)
Although some signals suggested that inflation pressures had peaked late in the first quarter, price pressures for both consumers and businesses remained near multi-decade highs. Evidence also arrived that inflation pressures were becoming more embedded in the economy and spreading beyond areas impacted by stressed energy and manufacturing supply chains. For example, consumer prices for services (excluding energy services) surged 0.7% in April, with airline fares jumping 18.6%, the largest increase on record.
Especially worrying to investors and policymakers appeared to be data in early June showing that consumers’ long-term inflation expectations were becoming unmoored. The data were later revised downward, however, and Fed Chair Jerome Powell testified before Congress that he believed expectations remained “anchored.”
Doubts Grow That Policymakers Will Achieve Soft Landing
Fears of a 1970s-style, supply-driven “stagflation” period of low growth combined with high inflation may have started to give way over the quarter to worries that the Fed would be unable to achieve a “soft landing” and push the economy into recession as happened in the early 1980s and early 1990s. As mortgage rates jumped, existing home sales pulled back sharply. Higher rates on car loans seemed partly to blame for a decline in retail sales in May, while inflation-adjusted incomes also fell slightly. By June, the University of Michigan’s gauge of consumer sentiment had fallen to its lowest level on record and to roughly half of its pre-pandemic levels.
The quarter ended with investors seemingly bracing themselves for major earnings downgrades as firms struggled with the softening economy and high input and wage costs. Shares of Target and some other major retailers fell sharply following earnings misses driven in part by overstocked inventories. Investors were also aware that year-over-year earnings comparisons were becoming more difficult given 2021’s surge in profits. As of the end of the quarter, analysts polled by FactSet were expecting the weakest quarterly profit growth since late 2020.
Shares in Europe fell by the most since coronavirus lockdowns began in early 2020. Worries about elevated inflation, aggressive monetary policy tightening by central banks, and the detrimental economic impact of the Russia-Ukraine conflict caused equities to ratchet lower. In local currency terms, the pan-European STOXX Europe 600 Index slid 10.67%. Major indexes in Germany, France, and Italy also dropped, while the UK FTSE 100 Index was better supported by the depreciation of its currency against the U.S. dollar. A weaker pound helps to bolster the index because many of its companies are multinationals with overseas revenues.
EU Agrees to Partial Ban on Russian Oil; Russia Cuts Gas Supplies
European Union (EU) leaders agreed to ban all seaborne Russian oil deliveries, covering about two-thirds of such imports, within months. Some countries that rely heavily on Russian energy supplied via pipelines were granted temporary exemptions after they voiced objections. The European Commission also announced a EUR 300 billion plan to end dependence on Russian energy imports before 2030.
Russia then began sharply reducing pipeline supplies to Germany, Italy, France, the Netherlands, and Slovakia, triggering fears of a severe winter shortage and industry closures. Some member states took measures to reduce consumption and counter a supply squeeze. Plans included the reopening of coal plants and, where possible, extending the lives of nuclear power stations.
ECB Set to Raise Rates in July; Other Central Banks Step Up Hikes
The European Central Bank (ECB) signaled that it plans to start raising its key deposit rate, which stands at -0.5% currently, by a quarter point in July to contain inflation. However, the ECB added, “If the medium-term inflation outlook persists or deteriorates, a larger increment will be appropriate at the September meeting.” The bank also confirmed that it would end net purchases of bonds under its main asset-buying program on July 1.
The central banks of Sweden, Norway, and Switzerland each increased rates by 50 basis points at the end of the quarter in a bid to stifle inflation. The Bank of England (BoE) stuck to its gradual approach, raising its key rate for a fifth time since December by 25 basis points. All these central banks indicated that more increases would be in the offing.
Economic Data Point to Deepening Slowdown
Weak economic data also stoked worries that the European economy could be stalling. Inflation in the eurozone accelerated to a record high of 8.6% in June as energy and food costs surged. Business activity in the euro area slowed in June to its lowest level since February 2021 according to a purchasing managers’ survey. Manufacturing output contracted for the first time in two years due to supply chain disruptions and weakening demand prospects. Service sector growth cooled considerably, especially in consumer-facing industries.
In the UK, gross domestic product unexpectedly shrank 0.3% in April after contracting 0.1% in March. The BoE forecast a 0.3% contraction for the second quarter. Inflation jumped to a record 9.1% in May as food costs rose at the fastest rate in 13 years.
Japanese equities fell over the quarter, with the MSCI Japan Index down 4.41% in yen terms and down 14.60% in U.S. dollar terms as concerns about the U.S. Federal Reserve’s (Fed’s) approach to fighting high inflation, including the potential to aggressively hike interest rates, weighed on risk appetite. The war between Russia and Ukraine continued to impact global inflation dynamics, while China’s zero-COVID-19 policy and lockdowns threatened to impede economic growth prospects. However, additional monetary easing in China and signs that the authorities there would allow segments of the economy to reopen in May, as well as the relaxation of Japan’s strict border controls and a strong expansion in services sector activity in June, served as tailwinds.
Yen Hovers Around a 24-Year Low
Against the backdrop of monetary policy divergence, with the Bank of Japan (BoJ) staunchly committed to its ultra-loose stance and the Fed and other major central banks in tightening mode, the yen hovered around its lowest level in 24 years, finishing the quarter at around JPY 135.75 against the U.S. dollar from about 121.69 at the end of March. BoJ Governor Haruhiko Kuroda reiterated his view that recent rapid yen moves were undesirable and that the central bank hoped to respond appropriately on currency markets in close cooperation with the government.
The yield on the 10-year Japanese government bond (JGB) ended the quarter broadly unchanged at 0.22%, as the BoJ continued to buy JGBs to defend the upper limit of its interest rate target range and announced toward the end of April that it would carry out its purchases every business day instead of on an ad hoc basis.
BoJ Maintains Ultralow Interest Rates; Inflation Remains Low Versus Other Developed Nations
At its June monetary policy meeting, the BoJ kept overnight interest rates at minus 0.1% and said it would conduct daily purchases of 10-year JGBs at a yield of 0.25%. In addition to sticking to its policy of yield curve control, the BoJ reiterated its commitment to quantitative and qualitative monetary easing in the pursuit of its 2% price stability target, for as long as it is necessary to maintain that target in a stable manner. The BoJ remained firmly in easing mode—despite rising inflation and a sliding yen—continuing its monetary policy divergence with global peers.
Japan’s core consumer price index rose 2.1% year on year in May, topping the BoJ’s 2% inflation target for the second consecutive month, as positive contributions increased in non-fresh food and household durables. While the BoJ’s inflation expectations have risen—particularly in the short term, and at a more moderate pace over the medium to long term—inflation, excluding such factors as energy, remains low compared with other developed nations.
Japan’s gross domestic product contracted by an annualized rate of 1% quarter on quarter during the first three months of 2022. Factors behind the contraction included deteriorating trade as import prices soared and sluggish consumer spending due to the coronavirus restrictions that had been in place.
Government Announces New Aid Package to Mitigate Impact of Rising Prices
Prime Minister Fumio Kishida’s government announced new measures—amounting to around JPY 6.2 trillion (USD 48.5 billion) according to Bloomberg—to cushion the impact of soaring prices on companies and consumers and support the economy’s still-fragile recovery from the coronavirus pandemic. These include raising the current subsidy for oil wholesalers, as well as extending support to small- and medium-sized companies and low-income households.
Chinese stocks advanced in the second quarter, with most of the gains coming in June. After falling in April, markets in China changed direction in May and then rallied in June, when China was the only major market to post positive returns. For the quarter, the MSCI China Index returned 3.5% and the MSCI A Onshore Index gained 1.65% in U.S. dollar terms according to MSCI.
Several factors supported the market’s recovery. The government’s efforts to tame the omicron outbreak allowed an end to strict lockdowns in Shanghai and parts of Beijing. Fresh policy support and economic data in June suggesting that the economy was recovering from the lockdowns also lifted buying sentiment.
The yield on China’s 10-year central government bond was flat over the quarter, trading in a narrow range to close at 2.837%. The yuan currency declined 0.6% against the U.S. dollar in June and fell 5.25% versus the greenback for the quarter to end at 6.6493. The yuan’s recent weakness against the dollar has raised worries for Chinese officials, who are mindful that a rapidly weakening currency could trigger increased capital outflows. However, a retracement in U.S. yields in the second half of June supported the Chinese currency.
Asian equity funds maintained a small China underweight at the end of May, while global equity funds were significantly underweight according to EPFR Global data. However, the recent rally in China’s markets reflected foreign investors’ renewed interest in Chinese stocks, with northbound flows to China via Hong Kong’s Stock Connect reaching the highest level since December 2021.
Lackluster economic data in May reflected the impact of coronavirus lockdowns. Retail sales, industrial output, and fixed asset investment all disappointed, and home prices in May fell for the ninth straight month. The lockdowns’ economic toll also resulted in weaker credit demand and export delays at the key port of Shanghai. The People’s Bank of China signaled its support for the country’s ailing property sector by cutting mortgage rates for first-time homebuyers and the five-year loan prime rate, a key reference rate for mortgages.
However, economic data in June were generally better than expected. The official manufacturing and services purchasing managers’ indices both rose above 50, indicating improving conditions, while high-frequency data also pointed to a recovery as lockdown restrictions eased. Beijing relaxed quarantine restrictions and fiscal policy in June, thereby helping the short-term outlook, even as President Xi Jinping said that China was firmly committed to its zero-COVID policy.
Range of Factors Drive Hungarian Equities Lower
Hungarian stocks, as measured by MSCI, returned -26.26% in U.S. dollar terms in the second quarter versus -11.34% for the MSCI Emerging Markets Index. Hungarian financial assets have been under considerable pressure this year, with equities dropping more than 40% in U.S. dollar terms since the end of 2021. Losses to U.S. investors have been exacerbated by weakness in the forint, which fell 13% versus the dollar in the second quarter and almost 15% the year to date.
The market’s poor performance stems from factors such as the country’s proximity to Ukraine, which has been attempting to repel a Russian invasion since late February that has also triggered a humanitarian crisis; controversies regarding the rule of law, which put EU funds for Hungary—both under the structural allocation and from the EU’s Recovery and Resilience Facility—at risk; and sanctions against Russia, on which Hungary depends for oil and natural gas.
In early June, following several weeks of negotiations among EU members, the EU agreed—as part of a new package of sanctions—to a partial embargo on Russian oil. Specifically, the EU will ban Russian oil imports by sea by the end of 2022. For now, Russian oil will continue to flow west via pipelines, but Germany and Poland have agreed to stop relying on these imports by the end of the year. However, in order to win support for the embargo from Prime Minister Viktor Orbán, who is on generally good terms with Russian President Vladimir Putin, Hungary was granted an exemption and may continue to import Russian oil without penalty. Slovakia and the Czech Republic were also granted exemptions.
In addition to the factors mentioned above, elevated inflation and rising interest rates have been chief concerns among investors. According to T. Rowe Price credit analyst Ivan Morozov, the overall inflation trend has strong momentum, as indicated by a 12.2% year-over-year core inflation rate through May versus 10.3% in April. This, coupled with protracted weakness in the forint, may have prompted the central bank to raise its key interest rate by 185 basis points—much more than expected—in late June. Morozov believes that tighter fiscal and monetary policies will result in a peak in inflation and signs of slower economic activity in the months ahead.
Colombian Stocks Fall Despite Insulation From Turmoil in Emerging Europe
Stocks in Colombia, as measured by MSCI, returned -27.62% in the second quarter versus -11.34% for the MSCI Emerging Markets Index. Colombian equities held up relatively well in the year-to-date period, returning -3.07% versus -17.47% for the MSCI Emerging Markets Index. Thanks in part to rising commodity prices, the resource-rich Latin American region has been somewhat insulated from the geopolitical turmoil in emerging Europe. Colombia is an exporter of petroleum and coal.
During the quarter, Colombia held the first and second rounds of its presidential election. On May 29, as expected, Gustavo Petro—an economist, former presidential candidate, and former left-wing guerilla—won the first round, winning 40.3% of the vote. Rodolfo Hernandez, a businessman and construction company owner, ended up garnering second place with 28.2%. With both Petro and Hernandez being from outside the political establishment, T. Rowe Price emerging markets sovereign analyst Aaron Gifford believes that the first-round results reflect strong demand for changes within Colombian society.
Following the runoff election on June 19, Colombian assets retreated as Petro narrowly defeated Hernandez with 50.4% of the vote. Petro’s campaign, including his promise to end oil exploration, had worried investors, but Gifford noted that the president-elect struck a conciliatory tone in his acceptance speech, in which he said that there would not be any persecution of his political opponents after he takes office on August 7. On the economic front, Petro said that his government would foster capitalism and that there would be no expropriation of private property. However, Gifford noted that Petro’s intentions for increasing growth through production and investment—especially in the agricultural, tourism, and renewable energy sectors—seemed to be geared toward providing more resources for redistribution.
Gifford will be monitoring the makeup of Petro’s cabinet for clues about the direction of the new government. He also notes that the legislature could provide a check on any radical proposals that Petro puts forth, as the large majority of Congress is moderate.
Major Index Returns
Total returns unless noted
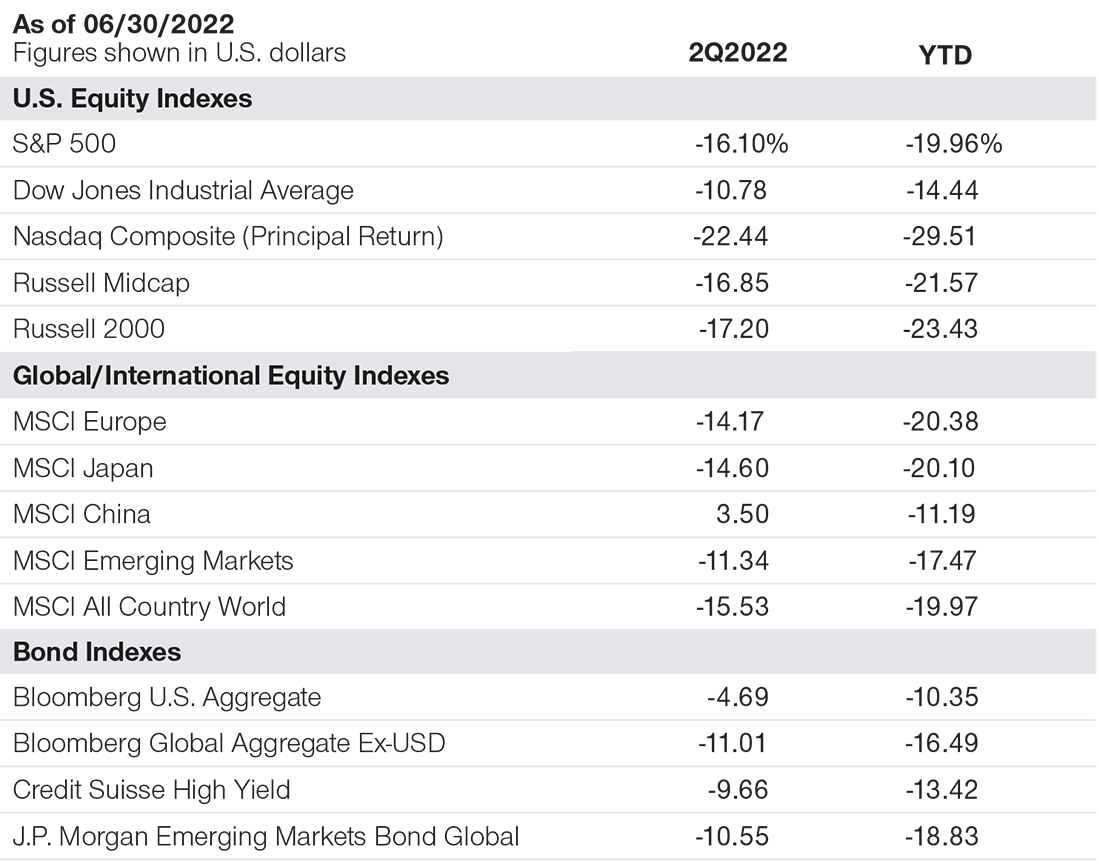
Past performance is not a reliable indicator of future performance.
Note: Returns are for the periods ended June 30, 2022. The returns include dividends and interest income based on data supplied by third‑party provider RIMES and compiled by T. Rowe Price, except for the Nasdaq Composite Index, whose return is principal only.
Sources: Standard & Poor’s, LSE Group, Bloomberg Index Services Limited, MSCI, Credit Suisse, Dow Jones, and J.P. Morgan (see Additional Disclosures).
Heading into the second half of 2022, higher inflation and rising interest rates remain the most serious threats to global financial markets. Russia’s invasion of Ukraine has added fire to those risks by pushing food and energy prices sharply higher and further disrupting global supply chains. This inflationary “shock on shock” has put more pressure on the Federal Reserve and other major central banks to tighten monetary policy, while making it more difficult for them to tame inflation without choking off economic growth.
The key question now is whether these risks will cause a sharp deceleration in growth or push major economies into full-blown recessions, dragging corporate earnings down as well. The second quarter ended with investors seemingly bracing themselves for major earnings downgrades as firms struggled with the softening economy and high input and wage costs.
Also, central bank liquidity was critical for stabilizing economies and markets during both the financial crisis and the coronavirus pandemic. But it helped push valuations for many risk assets toward historical extremes. The removal of this liquidity through monetary policy tightening could drive equity valuations lower, potentially adding to the detrimental effects of a downturn in earnings for investors.
Beyond the cyclical risks, investors need to consider that global markets may have reached a structural inflection point—an end to the era of ample liquidity, low inflation, and low interest rates that followed the 2008–2009 global financial crisis. However, this new paradigm also could offer potential opportunities for active portfolio managers with the skills and research capabilities needed to seek them out. The elevated levels of volatility and uncertainty in global markets underscore the value of our thoughtful strategic investing approach. Given the uncertain impact of positive and negative forces driving global financial markets, we believe that the strength of T. Rowe Price’s fundamental research platform should help us perform in a variety of market environments over the long term.
THE IN-DEPTH MARKET DETAILS YOU NEED
Subscribe to regular email updates and inform your client conversations.
-
The specific securities identified and described are for informational purposes only and do not represent recommendations.
Additional Disclosures
The S&P 500 Index is a product of S&P Dow Jones Indices LLC, a division of S&P Global, or its affiliates (“SPDJI”) and has been licensed for use by T. Rowe Price. Standard & Poor’s® and S&P® are registered trademarks of Standard & Poor’s Financial Services LLC, a division of S&P Global (“S&P”); Dow Jones® is a registered trademark of Dow Jones Trademark Holdings LLC (“Dow Jones”); T. Rowe Price is not sponsored, endorsed, sold or promoted by SPDJI, Dow Jones, S&P, their respective affiliates, and none of such parties make any representation regarding the advisability of investing in such product(s) nor do they have any liability for any errors, omissions, or interruptions of the S&P 500 Index.
London Stock Exchange Group plc and its group undertakings (collectively, the “LSE Group”). © LSE Group 2022. FTSE Russell is a trading name of certain of the LSE Group companies. “Russell®” is a trade mark(s) of the relevant LSE Group companies and is used by any other LSE Group company under license. All rights in the FTSE Russell indexes or data vest in the relevant LSE Group company which owns the index or the data. Neither LSE Group nor its licensors accept any liability for any errors or omissions in the indexes or data and no party may rely on any indexes or data contained in this communication. No further distribution of data from the LSE Group is permitted without the relevant LSE Group company’s express written consent. The LSE Group does not promote, sponsor or endorse the content of this communication. The LSE Group is not responsible for the formatting or configuration of this material or for any inaccuracy in T. Rowe Price Associates’ presentation thereof.
MSCI and its affiliates and third party sources and providers (collectively, “MSCI”) makes no express or implied warranties or representations and shall have no liability whatsoever with respect to any MSCI data contained herein. The MSCI data may not be further redistributed or used as a basis for other indices or any securities or financial products. This report is not approved, reviewed, or produced by MSCI. Historical MSCI data and analysis should not be taken as an indication or guarantee of any future performance analysis, forecast or prediction. None of the MSCI data is intended to constitute investment advice or a recommendation to make (or refrain from making) any kind of investment decision and may not be relied on as such.
“Bloomberg®” and Bloomberg U.S. Aggregate Bond, Bloomberg Global Aggregate Ex‑USD are service marks of Bloomberg Finance L.P. and its affiliates, including Bloomberg Index Services Limited (“BISL”), the administrator of the index (collectively, “Bloomberg”) and have been licensed for use for certain purposes by T. Rowe Price. Bloomberg is not affiliated with T. Rowe Price, and Bloomberg does not approve, endorse, review, or recommend its products. Bloomberg does not guarantee the timeliness, accurateness, or completeness of any data or information relating to its products.
© 2022 CREDIT SUISSE GROUP AG and/or its affiliates. All rights reserved.
Information has been obtained from sources believed to be reliable but J.P. Morgan does not warrant its completeness or accuracy. The index is used with permission. The Index may not be copied, used, or distributed without J.P. Morgan’s prior written approval. Copyright © 2022, J.P. Morgan Chase & Co. All rights reserved.
Important Information
This material is provided for informational purposes only and is not intended to be investment advice or a recommendation to take any particular investment action.
The views contained herein are as of the date written and are subject to change without notice; these views may differ from those of other T. Rowe Price associates.
This information is not intended to reflect a current or past recommendation concerning investments, investment strategies, or account types, advice of any kind, or a solicitation of an offer to buy or sell any securities or investment services. The opinions and commentary provided do not take into account the investment objectives or financial situation of any particular investor or class of investor. Please consider your own circumstances before making an investment decision.
Information contained herein is based upon sources we consider to be reliable; we do not, however, guarantee its accuracy.
Past performance is not a reliable indicator of future performance. All investments are subject to market risk, including the possible loss of principal. All charts and tables are shown for illustrative purposes only.
T. Rowe Price Investment Services, Inc., distributor, and T. Rowe Price Associates, Inc., investment adviser.
© 2022 T. Rowe Price. All rights reserved. T. ROWE PRICE, INVEST WITH CONFIDENCE, and the bighorn sheep design are, collectively and/or apart, trademarks or registered trademarks of T. Rowe Price Group, Inc.