


- On Asset Allocation
- A Fall in Earnings Estimates Could Worsen Sell‑Off
- 2022-08-03 12:04
- Key Insights
-
- Rising recession concerns have exacerbated the stock market sell‑off, and major indexes are now in or near bear market territory.
- Given optimistic forward earnings estimates, we believe current stock prices may not have fully baked in a recessionary scenario.
Deepening recession concerns have caused stocks to sell off precipitously in 2022, and major indexes recently reached bear market territory—meaning that they had fallen at least 20% from their recent highs. An in‑depth look at the sell‑off reveals that it has primarily been driven by a decrease in price‑to‑earnings (P/E) multiples (Figure 1).
Although some investors may conclude that stock valuations have now become reasonable, it is important to note that, despite numerous signs of looming economic weakness, earnings estimates have not adjusted downward this year. So far in 2022, the consensus 12‑month forward earnings-per-share (EPS) estimates have, in fact, risen by 4%. Therefore, while the current P/E ratio seems attractive, it is based on a very optimistic outlook for company earnings.
Anatomy of the 2022 Sell‑Off
(Fig. 1) The price‑to‑earnings (P/E) ratio of the S&P 500 has declined, but forward earnings estimates remain overly optimistic
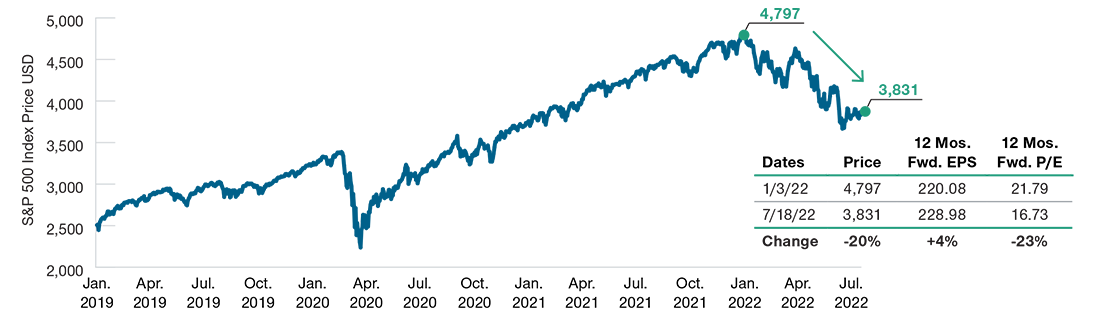
January 1, 2019, to July 18, 2022.
Past performance is not a reliable indicator of future performance.
Source: S&P. T. Rowe Price analysis using data from FactSet Research Systems Inc. All rights reserved. See Additional Disclosures. Bloomberg Finance, L.P.
Actual outcomes may differ materially from estimates. Estimates are subject to change.
How Far Could Earnings Estimates Fall?
(Fig. 2) Earnings estimates have fallen meaningfully during past recessions
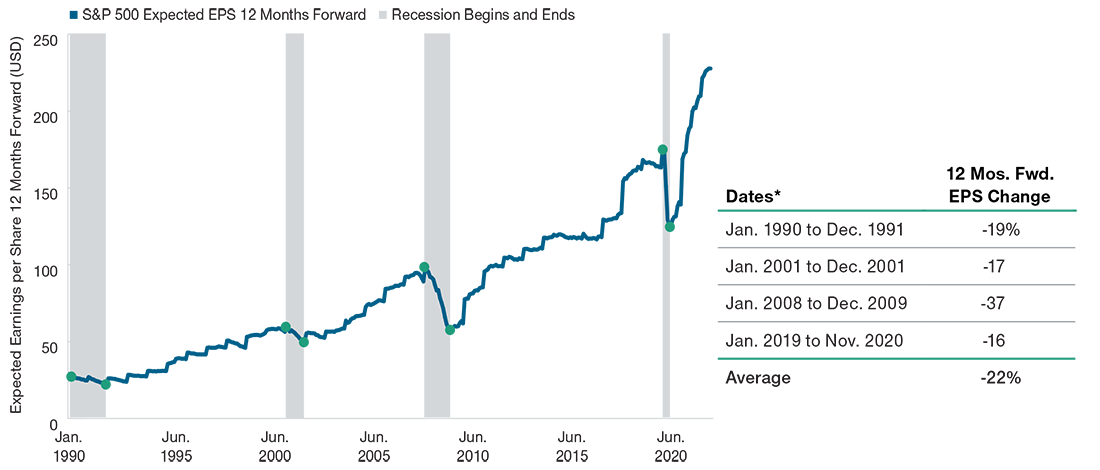
January 1990 to June 2022.
Sources: T. Rowe Price analysis using data from FactSet Research Systems Inc. All rights reserved. See Additional Disclosures. Bloomberg Finance, L.P.
Actual outcomes may differ materially from estimates. Estimates are subject to change. Past occurrences are not a reliable indicator of future occurrences.
*Recessionary periods are defined by the National Bureau of Economic Research (NBER).
For investors evaluating the current market environment, a review of historical data showing how earnings estimates have behaved during past recessions can be informative. Notably, an analysis of consensus earnings estimates for companies listed on the S&P 500 Index since 1990 shows that during each of the past four recessions, earnings estimates fell sharply, with an average drop of 22% (Figure 2).
Overall, stock prices seem more reasonably priced relative to their peaks early in the year. However, in our view, a recessionary scenario may not be fully baked in to the current share prices because earnings expectations remain too optimistic. As a result, our outlook remains cautious, and our Asset Allocation Committee has maintained an underweight allocation to stocks relative to bonds.
Get insights from our experts.
Subscribe to get email updates including article recommendations relating to asset allocation.
-
Additional Disclosures
The S&P 500 Index is a product of S&P Dow Jones Indices LLC, a division of S&P Global, or its affiliates (“SPDJI”) and has been licensed for use by T. Rowe Price. Standard & Poor’s® and S&P® are registered trademarks of Standard & Poor’s Financial Services LLC, a division of S&P Global (“S&P”); Dow Jones® is a registered trademark of Dow Jones Trademark Holdings LLC (“Dow Jones”); T. Rowe Price is not sponsored, endorsed, sold or promoted by SPDJI, Dow Jones, S&P, or their respective affiliates, and none of such parties make any representation regarding the advisability of investing in such product(s) nor do they have any liability for any errors, omissions, or interruptions of the S&P 500 Index.
Financial data and analytics provider FactSet. Copyright 2022 FactSet. All Rights Reserved.
Important Information
This material is provided for informational purposes only and is not intended to be investment advice or a recommendation to take any particular investment action.
The views contained herein are those of the authors as of August 2022 and are subject to change without notice; these views may differ from those of other T. Rowe Price associates.
This information is not intended to reflect a current or past recommendation concerning investments, investment strategies, or account types, advice of any kind, or a solicitation of an offer to buy or sell any securities or investment services. The opinions and commentary provided do not take into account the investment objectives or financial situation of any particular investor or class of investor. Please consider your own circumstances before making an investment decision.
Information contained herein is based upon sources we consider to be reliable; we do not, however, guarantee its accuracy.
Past performance is not a reliable indicator of future performance. All investments are subject to market risk, including the possible loss of principal. Fixed‑income securities are subject to credit risk, liquidity risk, call risk, and interest-rate risk. As interest rates rise, bond prices generally fall. All charts and tables are shown for illustrative purposes only.
T. Rowe Price Investment Services, Inc.
© 2022 T. Rowe Price. All Rights Reserved. T. ROWE PRICE, INVEST WITH CONFIDENCE, and the Bighorn Sheep design are, collectively and/or apart, trademarks of T. Rowe Price Group, Inc.