


- On Asset Allocation
- Parallels to the 1973 Market Shocks May Be Imprecise
- 2022-04-06 09:26
- Key Insights
-
- We analyzed seven geopolitical and commodity shocks from the early 1970s to the present.
- Our scenario analysis shows that these shocks did not typically hurt stocks, with the exception of the oil and agriculture shock of 1973.
- While there are similarities between the current environment and 1973, we think the reopening economic momentum will keep the U.S. out of recession.
Will Russia’s invasion of Ukraine and the spike in commodities prices cause the U.S. stock market to meaningfully underperform bonds? To add historical perspective to this question, we analyzed asset class returns and macroeconomic trends following seven geopolitical and commodity shocks from the early 1970s to the present. Our scenario analysis revealed that geopolitical and commodity shocks have not typically triggered equity underperformance. Of our seven scenarios, the dual shock of 1973 is the only worrisome analogy. Over the 12 months following the oil price spike of October 1973, stocks underperformed bonds1 by 30%.
A Shock on Top of a Shock
Are we facing a 1973‑like scenario? Like now, the 1973 scenario includes both oil and agricultural commodities—a shock on top of a shock. In the first shock, food prices skyrocketed on worldwide grain production issues. Then OPEC instituted the oil embargo that created the second shock. Inflation was already running high, and the oil crisis exacerbated it.
"…oil and commodity shocks push inflation higher and can wreck growth."
There are many differences between then and now, but both periods are a reminder that oil and commodity shocks push inflation higher and can wreck growth. The relationship between oil shocks and subsequent economic growth is less direct than for inflation, and the effect is always conflated with other variables. But there are three ways that inflation can lead to recession:
- Higher gas prices, which are a tax on the consumer.
- Inflation leading to wage growth, which eats into corporate profit margins.
- And, of course, inflation can force the Federal Reserve (Fed) to raise rates too aggressively.
Relative Returns of Stocks Were Mostly Resilient
(Fig. 1) Major external shocks* since the 1970s
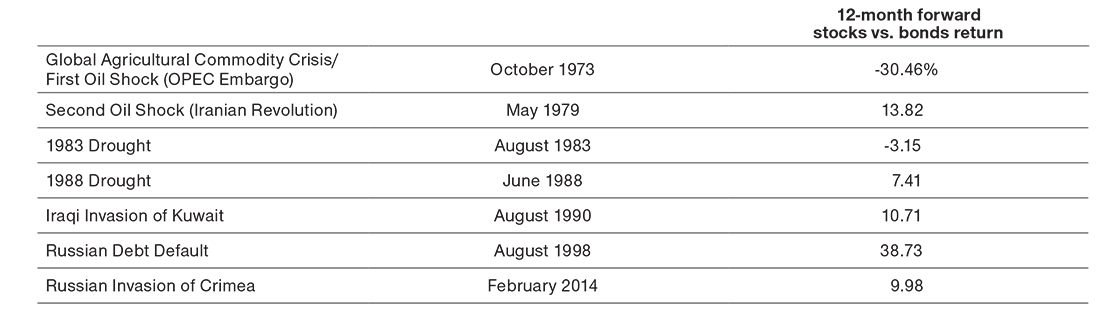
Past performance is not a reliable indicator of future performance.
*Analysis excludes smaller external shocks historically, which may have had different outcomes.
Stocks represented by the S&P 500 Index, January 1972–February 2022; bonds represented by the SBBI Intermediate Government Bond, January 1972–December 1976 and Bloomberg U.S. Aggregate Bond Index, January 1977–February 2022. Chart shows the subsequent 12-month return of stocks vs. bonds following the date of the major external shock. Index performance is for illustrative purposes only and indices cannot be invested into directly.
Source: Data analysis by T. Rowe Price.
What’s the Recession Risk?
If we want to compare the current situation with that of 1973, the most important question involves growth. What’s the recession risk? In our view, whether the oil shock is the direct cause does not matter that much.
Rising rates have not caused stocks to underperform over the last 30 years because the Fed hiked during expansions. But if the Fed really needs to fight inflation, which has not been a real issue for decades, the “Fed put”—easing monetary policy when equities fall meaningfully—may disappear, or a more severe downturn may be required for the Fed to come to the market’s rescue.
That is exactly what happened in 1973. The Fed was largely behind the curve, as some may say it is now. It raised the benchmark federal funds rate from 5.5% in December 1972 to 13% in June 1974—and then lowered it to 4.75% by March 1976! More importantly, the Fed kept hiking well into the recession, exacerbating the severity of the slowdown.
Stocks Lagged After 1973’s Dual Shocks
(Fig. 2) Relative returns of equities vs. bonds* before and after major external shocks
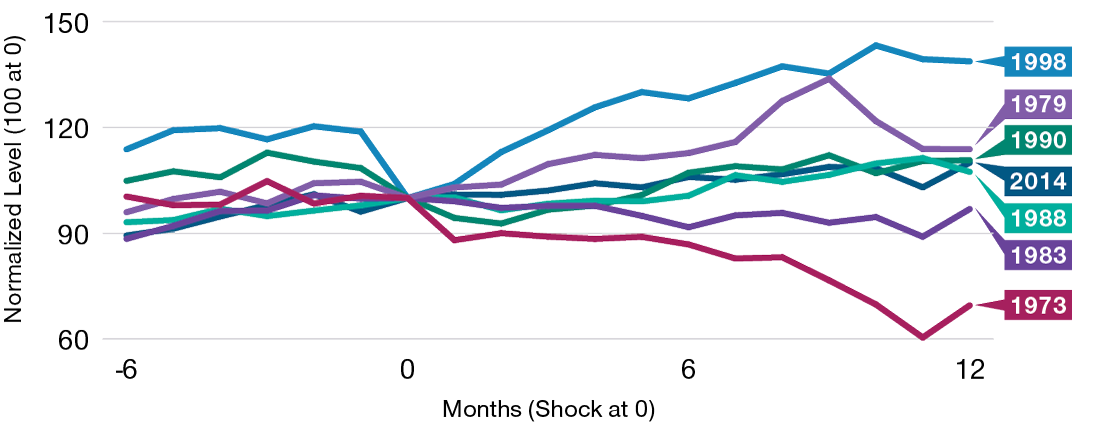
Past performance is not a reliable indicator of future performance.
*See Figure 1 for additional details regarding the analysis.
Source: Data analysis by T. Rowe Price.
Relative returns represent the outperformance or underperformance of stocks compared to bonds.
Index performance is for illustrative purposes only and indices cannot be invested into directly.
Positive Economic Forces of Reopening to Provide Support
Currently, growth is decelerating, but we are not as late in the economic cycle and we do not face as many disruptions as we did in 1973. Also, in 1973:
- The U.S. was a net importer of oil. Now the U.S. is (albeit barely) a net exporter.
- Consumption was 50% more dependent on petroleum products than it is now.
- The dollar was devalued. It remains strong now.
Following the oil shock of 1973, real gross domestic product (GDP) fell by just over 1.0% in the next 12 months. And the recession lasted two years. We do not think that is a realistic scenario for the current environment, given strong consumer and corporate balance sheets as well as the inescapable positive economic forces of the reopening. However, across almost all the historical shocks that we examined, inflation remained extremely elevated over the next 12 months.
Implications for Portfolio Positioning
What does this mean for positioning, looking forward six to 18 months? Our asset allocation committee is tactically positioned for rising rates, and we are overweight short‑term Treasury inflation‑protected securities (TIPS), bank loans, and value stocks, all of which could do well in an inflationary environment. Meanwhile, we remain slightly underweight to stocks, given elevated valuations and geopolitical and monetary policy uncertainty.
-
1 See Figure 1.
-
Important Information
This material is provided for informational purposes only and is not intended to be investment advice or a recommendation to take any particular investment action.
The views contained herein are those of the authors as of April 2022 and are subject to change without notice; these views may differ from those of other T. Rowe Price associates.
This information is not intended to reflect a current or past recommendation concerning investments, investment strategies, or account types, advice of any kind, or a solicitation of an offer to buy or sell any securities or investment services. The opinions and commentary provided do not take into account the investment objectives or financial situation of any particular investor or class of investor. Please consider your own circumstances before making an investment decision.
Information contained herein is based upon sources we consider to be reliable; we do not, however, guarantee its accuracy.
Past performance is not a reliable indicator of future performance. All investments are subject to market risk, including the possible loss of principal. The value approach to investing carries the risk that the market will not recognize a security’s intrinsic value for a long time or that a stock judged to be undervalued may actually be appropriately priced. In periods of no or low inflation, other types of bonds, such as US Treasury Bonds, may perform better than Treasury Inflation Protected Securities. Investments in bank loans may at times become difficult to value and highly illiquid; they are subject to credit risk such as nonpayment of principal or interest, and risks of bankruptcy and insolvency. All charts and tables are shown for illustrative purposes only. Index performance is for illustrative purposes only and is not indicative of any specific investment. Index performance does not reflect fees and expenses associated with an actual investment. Investors cannot invest directly in an index. Actual investment results may differ.
T. Rowe Price Investment Services, Inc.
© 2022 T. Rowe Price. All Rights Reserved. T. ROWE PRICE, INVEST WITH CONFIDENCE, and the Bighorn Sheep design are, collectively and/or apart, trademarks of T. Rowe Price Group, Inc.