


- On Natural Resources
- Higher Oil Prices Unlikely to Prove Sustainable
- Supply response and productivity gains should pressure prices.
- 2021-11-17 13:24
- Key Insights
-
- High oil prices are the cure for high oil prices. The supply response eventually should rebalance the market, returning prices closer to midcycle levels.
- Ongoing efficiency gains are likely to lower oil production costs, suggesting that crude could remain in a bear market for some time.
- We are cautious on energy and mining stocks, but the long-term dynamics in the specialty chemicals and paper packaging industries strike us as favorable.
High oil prices are still the cure for high oil prices. In October 2021, West Texas Intermediate (WTI) crude oil advanced to more than USD 80 per barrel—a level last seen in 2014—reflecting the mismatch between a sharp, year-over-year recovery in global energy demand as economies reopen and the time needed for the industry to ramp up output to pre-pandemic levels. The upsurge in oil prices has fueled a strong rally in energy stocks and contributed meaningfully to the inflationary pressures affecting both consumer prices and producer costs. While we see the potential risk of further oil price upside in the next quarter or two, our conviction in the secular bear market for commodities remains intact.
We’ve seen this story before. The prices of crude oil and other commodities tend to overshoot on the downside to disincentivize production when there is a negative demand shock and then rebound, temporarily, to artificially high levels as demand recovers to stimulate a supply response and rebalance the market. Even amid a global economic recovery, higher oil prices are unlikely to prove sustainable and, in our view, should start to recede toward midcycle levels at some point next year.
Given elevated equity valuations and commodity prices, we are remaining disciplined in our exposure to oil and gas producers and mining companies. On the other hand, we are finding what we regard as compelling opportunities in specialty chemicals and paper packaging.
Further Near-Term Upside for Oil Prices?
We do not believe that fundamentals support a prolonged bull market in oil, but we see the potential for crude prices to remain elevated in the near term.
Although WTI has climbed to levels that we believe should be sufficient to engender the supply response needed to balance the market, it still takes time for energy producers to ramp up activity and output because of the coronavirus pandemic and the challenges of mobilizing people and equipment after suffering through two oil price collapses in the past five years.
At the same time, surging prices in international gas markets threaten to increase demand for crude oil as an alternative feedstock in electricity generation and industrial applications. Among other factors, we believe that this unusual strength reflects temporary supply outages and increased competition from Asia and Latin America for liquefied natural gas (LNG) cargos. The international market could tighten further if cold temperatures in the Northern Hemisphere spur heating demand, a scenario that would likely propel natural gas prices even higher and increase the call on crude oil as a substitute thermal fuel.
"We do not view the upsurge in Asian and European natural gas prices as a product of a structural change in this commodity market."
We do not view the upsurge in Asian and European natural gas prices as a product of a structural change in this commodity market. As heating demand recedes in the spring and some of the temporary factors that have tightened the natural gas market start to alleviate, we would expect inventory levels to rebuild and prices to normalize, reducing crude oil’s appeal as a replacement fuel.
Cost of Capital for High Yield U.S. Energy Producers Appears Favorable
(Fig. 1) Yield spreads vs. 10-Year U.S. Treasuries
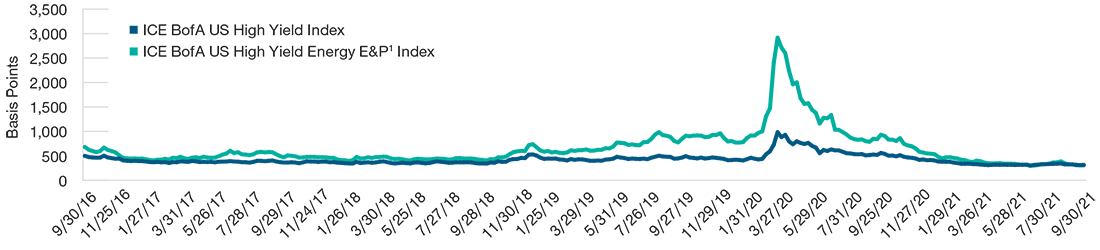
September 30, 2016, to September 30, 2021.
Source: ICE BofA via data provided by FactSet Research Systems, Inc. All rights reserved. Data analysis by T. Rowe Price. (See Additional Disclosure.)
1 Energy E&P is oil and gas exploration and production company.
Rebalancing After an Unprecedented Shock
The magnitude of the oil demand shock stemming from the coronavirus pandemic was unprecedented and briefly plunged WTI prices to negative levels in April 2020—a clear signal that energy companies needed to curtail their output. This year, the recovery in oil production has lagged the sharp recovery in crude oil demand as economic activity has resumed, sending WTI prices to levels that should prompt the energy sector to accelerate drilling.
Some market participants have questioned whether the supply response will be enough. A narrative has emerged that U.S. shale players’ capital discipline and potential disinvestment in oil and gas development because of environmental, social, and governance (ESG) concerns have contributed to and could sustain higher oil prices.
But evidence suggests that we are seeing the familiar pattern of oil prices and industry activity levels overshooting to the downside and then to the upside in response to an extreme market dislocation. Debt issuance and credit spreads indicate that high yield energy companies continue to enjoy access to the capital markets, despite the market’s increased sensitivity to ESG factors (Figure 1). More importantly, the U.S. oil-directed rig count has increased at a similar pace off the bottom as in 2016 and 2017 (Figure 2), when drilling activity began to rebound from a downcycle driven by surging hydrocarbon output from shale and OPEC’s decision not to cut supply.
"...we believe that the market does not fully appreciate the massive strides that the industry has made in producing more oil and gas with fewer rigs over the past three years."
Admittedly, the recent recovery in the U.S. oil-directed rig count has occurred from a lower base. However, we believe that the market does not fully appreciate the massive strides that the industry has made in producing more oil and gas with fewer rigs over the past three years. In our view, the U.S. oil-directed rig count has already recovered to levels that, eventually, should generate at least the incremental output needed to fill the gap created by typical demand growth and the base decline rate in production from existing wells.
Pace of Rebound in U.S. Drilling Activity Resembles 2016–2017 Recovery
(Fig. 2) Change in U.S. oil-directed rig count (Index 100)
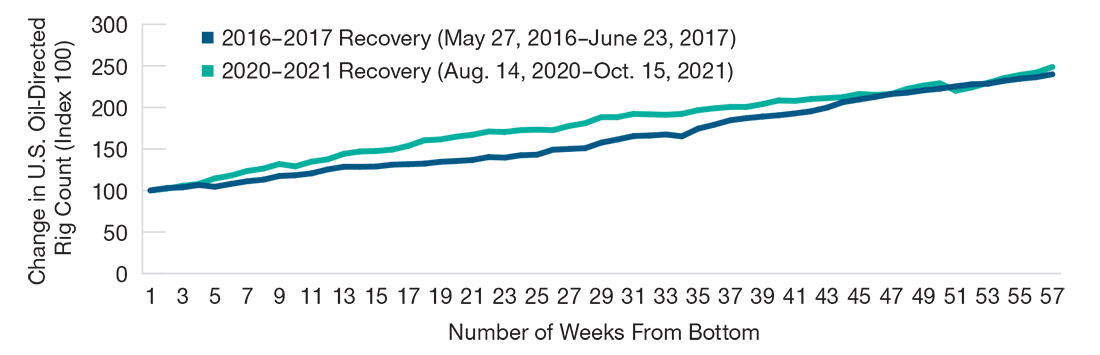
Source: Baker Hughes via data provided by FactSet Research Systems, Inc. All rights reserved. Data analysis by T. Rowe Price.
More Pain From Productivity Gains
Looking beyond the rebalancing process that should take place as the industry steps up drilling and well completion in response to higher prices, we see the potential for ongoing productivity gains to continue to pressure the cost curve for oil and, accordingly, higher-cost operators’ profit margins on invested capital.
Going forward, the pace of efficiency gains in U.S. shale may slow from the rapid rates experienced over the past seven to 10 years. However, there is likely significant room for progress. Rig productivity in the Permian Basin, an area in West Texas and New Mexico that we believe contains some of the best reservoir rock in the U.S. onshore market, eventually should catch up with operations in the Bakken region, an area predominantly in North Dakota that is further along in its development cycle (Figure 3). We also continue to monitor leading upstream operators’ efforts to improve overall resource recovery rates from shale formations—currently estimated at 7% to 8% of oil in place—through various innovations that would boost reservoir pressures.
And the potential productivity gains aren’t restricted to U.S. shale. The costs associated with offshore and deep-water oil and gas production also have come down significantly. Factors at play include an increasing emphasis on opportunities that tie in to existing infrastructure, a focus on new developments that target high-quality reserves without taking on too much engineering complexity, and material deflation in service and equipment costs.
A Preview of Potential Rig Productivity Gains to Come?
(Fig. 3) Oil output per drilling rig, Bakken vs. Permian Basin*
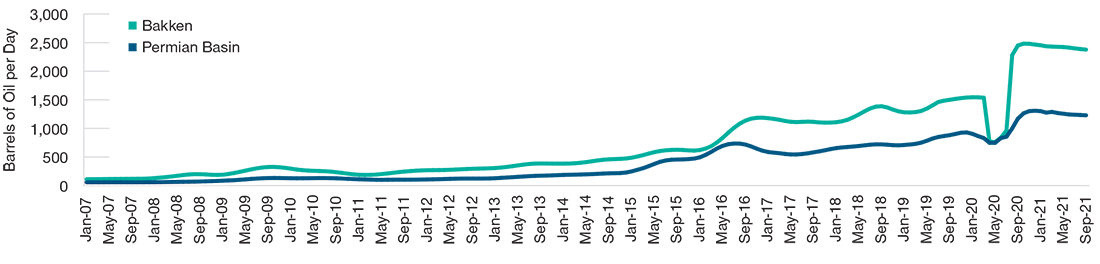
January 2007 to September 2021.
Source: U.S. Energy Information Administration (October 18, 2021).
*The Bakken is an oil-producing region predominantly in North Dakota that is further along in its development life cycle than the Permian Basin, an area in West Texas and New Mexico. Note that extreme oil supply and demand shocks, such as the ones experienced in 2016 and 2020, can distort drilling efficiency metrics because of the consequent drawdown in the active rig count and, then, during the initial stages of the recovery phase, the completion of backlogs of drilled but uncompleted wells, leading to increased production at a lower rig count. We believe that oil and gas producers should retain some of the incremental efficiency gains that occurred during the downturn, as in 2016.
Pockets of Potential Opportunity
The combination of what we regard as elevated valuations and commodity prices in the context of a longer-term bear market creates, in our view, an unfavorable risk/reward setup for many of the higher-beta segments in the natural resource universe. Accordingly, we remain selective in our energy and mining investments. In keeping with our mandate, we aim to maintain a philosophically appropriate level of risk-adjusted exposure to these commodity-sensitive industries through valuation discipline and a focus on what we regard as the highest-quality names.
"Specialty chemicals is one area that we like, as we believe that the industry should benefit over the long term from lower commodity prices."
Specialty chemicals is one area that we like, as we believe that the industry should benefit over the long term from lower commodity prices. The setup in companies that focus on paints and other coating products strikes us as potentially attractive. Historically, the best of these firms have been able to protect margins by passing along rising input costs to customers and then retained a portion of these pricing gains when oil prices eventually recede.
We also prefer investments in industries in which a rising incentive cost curve can pull commodity prices higher, potentially improving producers’ profit margins. For example, over the next three to five years, we expect demand growth related to online shopping and the increasing substitution of paper for plastic packaging to be a tailwind for containerboard producers. In contrast to the energy sector, we see the potential for the cost of adding incremental capacity to rise in the coming years, in part, because the number of existing paper plants that could be converted inexpensively to producing cardboard has dwindled. This scenario of increasing demand and, critically, rising cost curves on the supply side should support higher containerboard prices—and, in our view, potentially higher profit margins for the industry’s leading players.
We are believers in the longer-term transition from fossil fuels to renewable energy. In our view, the market does not fully appreciate the potential for durable growth in utilities’ rate bases and cash flows as they add wind and solar power capacity, reinforce critical infrastructure against extreme weather, and upgrade the grid to support increasing adoption of clean energy and electric vehicles. We’re also keeping a close eye on emerging innovations and longer-duration trends in energy storage and transmission as we seek other businesses that might benefit from the rise of renewables.
-
Additional Disclosure
ICE Data Indices, LLC (“ICE DATA”), is used with permission. ICE DATA, ITS AFFILIATES AND THEIR RESPECTIVE THIRD-PARTY SUPPLIERS DISCLAIM ANY AND ALL WARRANTIES AND REPRESENTATIONS, EXPRESS AND/OR IMPLIED, INCLUDING ANY WARRANTIES OF MERCHANTABILITY OR FITNESS FOR A PARTICULAR PURPOSE OR USE, INCLUDING THE INDICES, INDEX DATA AND ANY DATA INCLUDED IN, RELATED TO, OR DERIVED THEREFROM. NEITHER ICE DATA, ITS AFFILIATES NOR THEIR RESPECTIVE THIRD-PARTY SUPPLIERS SHALL BE SUBJECT TO ANY DAMAGES OR LIABILITY WITH RESPECT TO THE ADEQUACY, ACCURACY, TIMELINESS OR COMPLETENESS OF THE INDICES OR THE INDEX DATA OR ANY COMPONENT THEREOF, AND THE INDICES AND INDEX DATA AND ALL COMPONENTS THEREOF ARE PROVIDED ON AN “AS IS” BASIS AND YOUR USE IS AT YOUR OWN RISK. ICE DATA, ITS AFFILIATES AND THEIR RESPECTIVE THIRD-PARTY SUPPLIERS DO NOT SPONSOR, ENDORSE, OR RECOMMEND T. ROWE PRICE OR ANY OF ITS PRODUCTS OR SERVICES.
Important Information
Call 1-800-225-5132 to request a prospectus or summary prospectus; each includes investment objectives, risks, fees, expenses, and other information you should read and consider carefully before investing.
This material is provided for informational purposes only and is not intended to be investment advice or a recommendation to take any particular investment action.
The views contained herein are those of the authors as of November 2021 and are subject to change without notice; these views may differ from those of other T. Rowe Price associates.
Because of the cyclical nature of natural resource companies, their stock prices and rates of earnings growth may follow an irregular path. Factors such as natural disasters, declining currencies, market illiquidity, or political instability in commodity-rich nations could also have a negative impact on various portfolio holdings and cause a drop in share prices.
This information is not intended to reflect a current or past recommendation concerning investments, investment strategies, or account types, advice of any kind, or a solicitation of an offer to buy or sell any securities or investment services. The opinions and commentary provided do not take into account the investment objectives or financial situation of any particular investor or class of investor. Please consider your own circumstances before making an investment decision.
Information contained herein is based upon sources we consider to be reliable; we do not, however, guarantee its accuracy.
Past performance is not a reliable indicator of future performance. All investments are subject to market risk, including the possible loss of principal. All charts and tables are shown for illustrative purposes only.
T. Rowe Price Investment Services, Inc.
© 2021 T. Rowe Price. All Rights Reserved. T. ROWE PRICE, INVEST WITH CONFIDENCE, and the Bighorn Sheep design are, collectively and/or apart, trademarks of T. Rowe Price Group, Inc.