


- On U.S. Fixed Income
- Short Duration Bonds May Provide Portfolio Ballast
- Seeking incremental yield through a multi‑sector approach.
- 2021-08-03 12:50
- Key Insights
-
- We think that the Short Duration Income Fund’s flexible, multi‑sector approach can help provide a reasonable yield while also controlling interest rate risk.
- The shorter‑maturity segment of the yield curve has unique structural characteristics that could make it an attractive segment for fixed income investors.
- Our multi‑sector approach gives us the flexibility to add exposure to the fixed income sectors where we identify the potential for higher risk‑adjusted yield.
With inflation fears rising and intermediate‑ and long‑term rates appearing likely to increase, the trade-off between yield opportunity and interest rate risk has come into sharp relief. We believe that investors may want to consider a shorter‑duration1 portfolio in aiming to limit interest rate risk. However, moving to a shorter duration often means sacrificing yield. By applying a flexible, multi‑sector approach to managing a low-duration portfolio, we think that the Short Duration Income Fund can help provide a reasonable yield while also controlling interest rate risk.
Unique Structural Characteristics of Low-Duration Investments
The shorter‑maturity segment of the yield curve has some unique structural characteristics that could make it an attractive segment for fixed income investors even outside of the current environment of worries about inflation. Investment‑grade bonds in the one‑ to three‑year maturity category currently provide more yield per unit of duration than longer maturities,2 so taking on additional interest rate risk by moving to longer maturities likely provides diminishing marginal benefit in terms of yield.
Higher Risk‑Adjusted Return Historically
(Fig. 1) Information ratio of rolling excess return4 by maturity
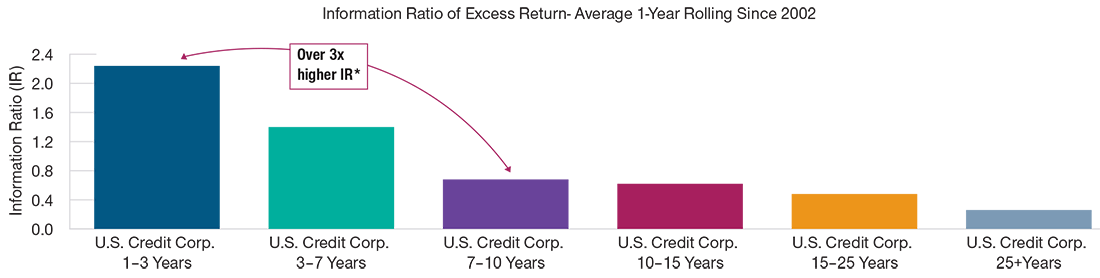
As of June 30, 2021.
Past performance is not a reliable indicator of future performance.
Source: T. Rowe Price analysis of Bloomberg Barclays indexes (see Additional Disclosure).
Time period: December 2002–June 2021.
In investment‑grade corporate credit, in particular, short‑maturity debt has historically provided meaningfully higher risk‑adjusted returns than longer‑term bonds.3 From December 2002 through June 2021, the information ratio of the average one‑year rolling excess return4 of investment‑grade corporates in the one‑ to three‑year maturity range was more than three times higher than the same measure for 7- to 10‑year investment‑grade corporate bonds.
Focus on Maximizing Carry and Roll Down
The majority of returns in short‑maturity bonds come from carry (interest income in excess of the risk‑free rate) and “rolling down the curve,” not price appreciation. Rolling down the curve refers to the potential gains experienced as a bond approaches maturity in a positively sloped yield curve environment.
"...we focus our portfolio construction analysis on identifying securities that we believe offer superior carry and roll-down dynamics."
Because of this unique dynamic, we focus our portfolio construction analysis on identifying securities that we believe offer superior carry and roll-down dynamics. Specifically, we focus on maximizing carry and roll‑down by concentrating on the one‑ to three‑year maturity segment. This portion of the yield curve also features higher historical risk‑adjusted returns than the four‑ to seven‑year or longer segments.
Flexibility to Pursue Diversified Sources of Income
Within the low-duration investment universe, our multi‑sector approach gives us the flexibility to add exposure to the fixed income sectors where we identify securities with higher risk‑adjusted yield potential or try to take advantage of relative value opportunities. We apply the insights of T. Rowe Price’s global research platform in seeking to optimize allocations across an expanded opportunity set, including agency mortgage‑backed securities (MBS), securitized credit, corporate bonds (both investment‑grade (IG) and high yield (HY)), and emerging markets (EM) debt.
Bulk of Historical Total Return From Carry and Roll
(Fig. 2) Components of total excess return*
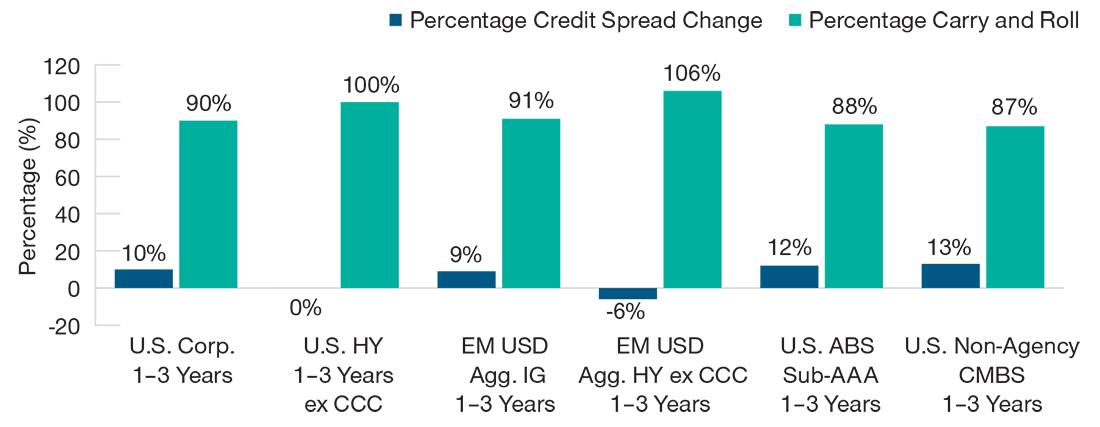
Past performance is not a reliable indicator of future performance.
Source: T. Rowe Price analysis of 1- to 3-year Bloomberg Barclays indexes (see Additional Disclosure).
*Total excess return for 10 years ended June 30, 2021.
Credit spreads measure the additional yield that investors demand for holding a bond with credit risk over a similar‑maturity, high‑quality government security. Returns in excess of duration matched Treasuries used for all sectors. Rolldown estimated as the beginning of period spread difference between the index and the 1-year spread duration shorter index each week. Different time periods or calculation methodology may yield different results.
This flexibility also provides the ability to diversify risk across sectors with varying levels of credit risk. Sectors such as asset‑backed securities (ABS), commercial mortgage‑backed securities (CMBS), and dollar‑denominated emerging markets debt have historically demonstrated relatively low correlation5 with the Bloomberg Barclays 1–3 Year U.S. Corporate Investment Grade Bond Index. We can also include an allocation to shorter‑maturity high yield bonds, which can provide a source of idiosyncratic return, act as a diversifier for Treasuries and other portfolio components, and potentially limit interest rate risk because of their relatively low duration. High yield exposure is limited to 35% of the fund’s net assets but has typically been 10% to 20%.
Relatively Attractive Yield Potential With Limited Duration
This diversified multi‑sector approach allows the fund to pursue reasonable yields while maintaining meaningfully shorter duration than funds that invest in longer-maturity securities. As of June 30, the weighted-average duration of the fund’s underlying holdings was only 1.65 years. In comparison, the duration of the Bloomberg Barclays U.S. Aggregate Bond Index (a common index of intermediate‑maturity investment‑grade bonds) was 6.48 years. The strategy’s lower interest rate risk can be valuable in an inflationary environment.
Active Duration Management
We also actively manage duration to help mitigate interest rate risk and try to take advantage of yield curve changes to enhance risk‑adjusted returns. We can make tactical adjustments based on our outlook for rates but, as a short-duration portfolio, the overall duration of the fund is typically three years or less. Also, because Treasuries and credit have often been negatively correlated, we usually employ a slightly longer duration as a potential hedge for the fund’s credit exposure when the environment is more supportive of taking interest rate risk. This hedging position could also provide a modest boost to the fund’s carry.
We are closely monitoring communications from the Federal Reserve for indications of when the central bank could begin to slow the pace of its massive monthly purchases of Treasuries and agency MBS. However, we do not anticipate a repeat of 2013’s taper tantrum, when yields across the curve sharply increased after Ben Bernanke, then Fed chairman, said that the central bank would taper its bond buying.
-
Key Risks—The following risks are materially relevant to the strategy highlighted in this material:
Debt securities could suffer an adverse change in financial condition due to ratings downgrade or default, which may affect the value of an investment. Fixed income securities are subject to credit risk, liquidity risk, call risk, and interest rate risk. As interest rates rise, bond prices generally fall. Mortgage-backed securities are subject to credit risk, interest rate risk, prepayment risk, and extension risk. Investments in high yield bonds involve greater risk of price volatility, illiquidity, and default than higher-rated debt securities. Derivatives may be riskier or more volatile than other types of investments because they are generally more sensitive to changes in market or economic conditions; risks include currency risk, leverage risk, liquidity risk, index risk, pricing risk, and counterparty risk. Diversification cannot assure a profit or protect against loss in a declining market. Yields are not guaranteed and are subject to change.
1 Duration measures a bond’s sensitivity to changes in interest rates.
2 As of June 24, 2021, the yield to maturity divided by option‑adjusted duration for the maturity segments of the Bloomberg Barclays U.S. Credit Corporate Index were: 0.34 for 1–3 years, 0.32 for 3–7 years, 0.32 for 7–10 years, 0.29 for 10–15 years, 0.24 for 15–25 years, and 0.19 for greater than 25 years. Subject to change.
3 Based on a comparison of the 1- to 3-year and 7- to 10-year maturity segments of the Bloomberg Barclays U.S. Credit Corporate Index. Past performance is not a reliable indicator of future performance.
4 The information ratio is a measure of risk‑adjusted return calculated as the difference between the segment excess return and the broad index excess return, divided by the tracking error (the standard deviation, or volatility of the return difference). Excess return is return of the noted segment above that of duration‑matched Treasury securities.
5 Correlation measures how one asset class, style, or individual group may be related to another. A perfect positive correlation means that the correlation coefficient is exactly 1. This implies that as 1 security moves, either up or down, the other security moves in lockstep in the same direction. A perfect negative correlation means that 2 assets move in opposite directions, while a zero correlation implies no relationship at all.
-
Additional Disclosure
Bloomberg Index Services Limited. BLOOMBERG® is a trademark and service mark of Bloomberg Finance L.P. and its affiliates (collectively “Bloomberg”). BARCLAYS® is a trademark and service mark of Barclays Bank Plc (collectively with its affiliates, “Barclays”), used under license. Bloomberg or Bloomberg’s licensors,x including Barclays, own all proprietary rights in the Bloomberg Barclays Indices. Neither Bloomberg nor Barclays approves or endorses this material, or guarantees the accuracy or completeness of any information herein, or makes any warranty, express or implied, as to the results to be obtained therefrom and, to the maximum extent allowed by law, neither shall have any liability or responsibility for injury or damages arising in connection therewith.
Important Information
Call 1-800-225-5132 to request a prospectus or summary prospectus; each includes investment objectives, risks, fees, expenses, and other information you should read and consider carefully before investing.
This material is provided for informational purposes only and is not intended to be investment advice or a recommendation to take any particular investment action.
The views contained herein are those of the authors as of August 2021 and are subject to change without notice; these views may differ from those of other T. Rowe Price associates.
This information is not intended to reflect a current or past recommendation concerning investments, investment strategies, or account types, advice of any kind, or a solicitation of an offer to buy or sell any securities or investment services. The opinions and commentary provided do not take into account the investment objectives or financial situation of any particular investor or class of investor. Please consider your own circumstances before making an investment decision.
Information contained herein is based upon sources we consider to be reliable; we do not, however, guarantee its accuracy.
Past performance is not a reliable indicator of future performance. All investments are subject to market risk, including the possible loss of principal. All charts and tables are shown for illustrative purposes only.
T. Rowe Price Investment Services, Inc.
© 2021 T. Rowe Price. All Rights Reserved. T. ROWE PRICE, INVEST WITH CONFIDENCE, and the Bighorn Sheep design are, collectively and/or apart, trademarks of T. Rowe Price Group, Inc.