


- On Emerging Markets
- Is the Value Rally in Emerging Markets Sustainable?
- Value investing is coming in from the cold.
- 2021-08-31 11:40
- Key Insights
-
- Our Emerging Markets (EM) “Discovery” thesis seeks to invest in forgotten stocks about to experience fundamental change. The transition to green energy provides one such potential opportunity.
- The way EM governments employ fiscal stimulus has changed to targeting the consumer directly. This is another fundamental change that we seek to capture.
- With a capex‑depreciation ratio around 1.0, nonfinancial EM companies have been underinvesting. This is poised to change, bringing new investment opportunities.
After a decade of strong value outperformance in emerging market equities from 2001 to 2010 came a decade of sustained underperformance. In 2020, the value/growth divergence in EM reached an extreme not seen before, driven by the deep recession created by the global coronavirus pandemic (Figure 1). Before examining the disappointing performance of EM value since 2010, we should first ask ourselves “What drove value’s outperformance between 2000 and 2010?” We believe there were two key factors at work. First, there was the Chinese economic supercycle as China spent a staggering USD 12 trillion on infrastructure and industrial capacity over this period. This benefited “old economy” sectors globally, such as steel, cement, nonferrous metals, industrial machinery, and energy. Second, the world was starting to recover following a number of EM shocks (1994 Latin American tequila crisis, 1997–1998 Asian financial crisis, 1998 Russian crisis) during which a large amount of capital expenditure (capex) and many banks had been destroyed.
EM Style Divergence Has Been Retreating From Extreme Levels
(Fig. 1) Annual value‑growth divergence for MSCI EM indices (%).
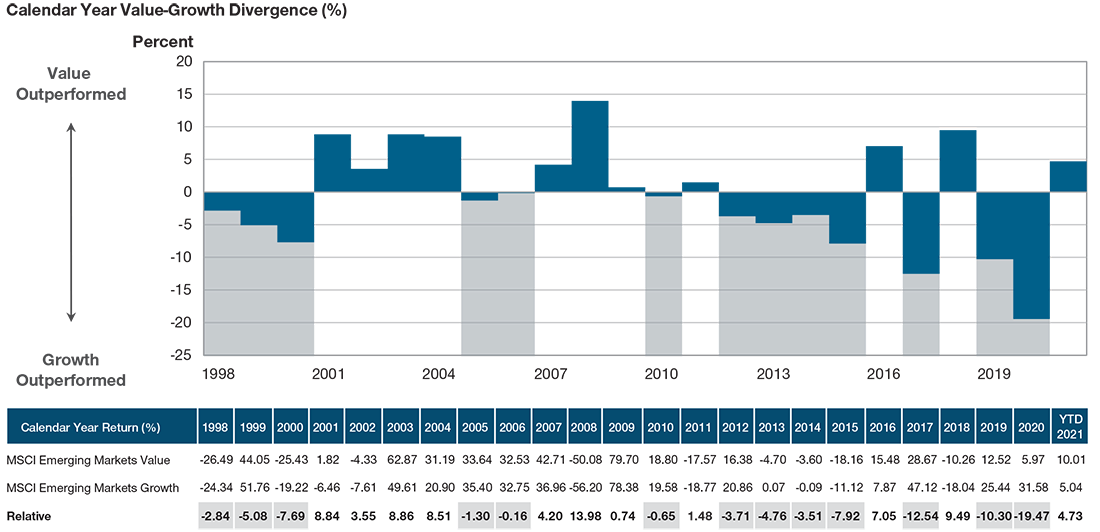
Past performance is not a reliable indicator of future performance.
As at June 30, 2021.
Source: Financial data and analytics provider FactSet. Copyright 2021 FactSet. All Rights Reserved. See Additional Disclosures.
Is This Episode Relevant to Investors Today?
We believe that it is, since although history does not repeat itself, it very often rhymes! We are of the view that the goal of carbon neutrality by 2050 (2060 for China) will boost many traditional or old economy industries during the long anticipated transition period. To meet green energy and carbon emission targets, the world will need to spend heavily on traditional industrial sectors during the transition years.
"China is projected to need to spend around USD 10–15 trillion to transition to a more energy‑efficient economy with zero net carbon emissions by 2060.…"
The massive USD 12 trillion of infrastructure spending in China between 2000 and 2010 was one factor contributing to a decade of outperformance for global value investors. Today, China is projected to need to spend around USD 10–15 trillion to transition to a more energy‑efficient economy with zero net carbon emissions by 2060 that do not rely on fossil fuels (Figure 2). This is a sum not very different in magnitude to what China spent on infrastructure and industrialization over 2000–2010. The G10 group of industrialized economies may also need to spend a roughly similar amount on their own green energy transition programs to achieve carbon neutrality in 2050.
China Supercycle vs. Post‑COVID‑19 Energy Transition
(Fig. 2) To meet green targets, the world needs to spend.
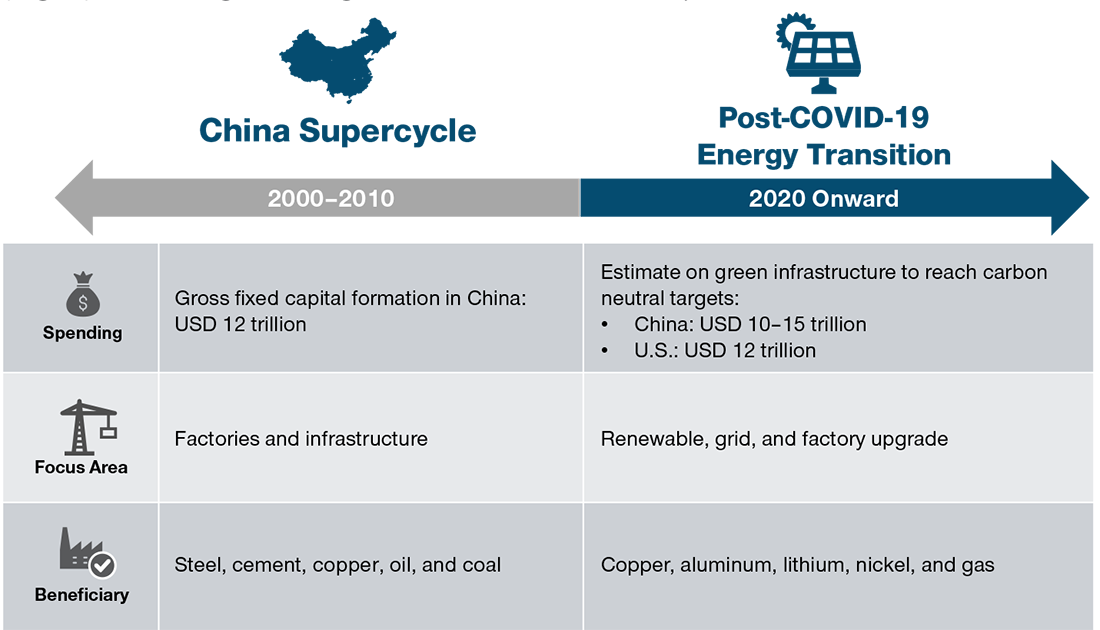
As of December 31, 2020.
Sources: Haver Analytics/China National Bureau of Statistics, UBS Investment Bank and Goldman Sachs & Company.
Actual future outcomes may differ materially.
Energy Transition Is Commodity Intensive
During the anticipated transition to clean energy, the world will likely need to spend heavily on commodities like copper, nickel, lithium, aluminum, and natural gas as alternative energy and electric vehicles are metals‑intensive. While a more controversial issue in developed markets, there are also few alternatives to natural gas, the cleanest of the fossil fuels, for EM during the early stages of their fossil fuel transition. In an EM context, this makes sense from an ESG perspective, since gas is less polluting than other carbon‑based fuels and hospitals, schools, fire stations, etc., all need power. Renewable energy is not readily available in most EMs, and we believe natural gas will play an important role in the early stages of their transition to cleaner energy.
Investment Must Rise to Reach Net Carbon Targets
The anticipated post‑COVID‑19 energy transition is the type of external fundamental change that we seek to leverage under our EM “Discovery” investment thesis. It is a theme that Portfolio Managers Ernest Yeung and Haider Ali have spent a good deal of time analyzing. The world has badly underinvested in this area, and countries will likely need to ramp up capital expenditure quickly if net carbon reduction targets in 2050 are to be met.
"The post‑COVID‑19 energy transition is the type of external fundamental change that we seek to leverage under our EM ‘Discovery’ investment thesis."
Figure 3 shows that the MSCI AC World CAPEX to depreciation ratio (ex‑financials) is currently hovering around 1.0, pointing to the fact that companies in recent years have mostly been spending on maintenance capex, investing “for balance sheet rather than for growth.” This time there was no financial crisis—rather, the underinvestment was caused by:
- China overspending on industrial capex after the global financial crisis—we have spent 10 years digesting that excess capacity.
- The massive performance divergence between growth and value sectors in stock market terms meant that capital exited the old economy sectors and flowed into the new economy.
We believe this will all have to change as the switch to green energy should begin to gather pace and capital flow back to the old economy. The share of investment spending in gross domestic product (GDP) will need to rise, potentially becoming a new driver for economic growth during the green energy transition.
"Following a successful vaccine rollout and strong global economic recovery, value investing has staged an impressive rebound in 2021."
Following a successful vaccine rollout and strong global economic recovery, value investing has staged an impressive rebound in 2021. While this has been welcomed, investors in EM value funds are naturally asking whether the outperformance of value can be sustained. We believe that it can. For one thing, we believe that the way governments supported their economies with fiscal and monetary stimulus during the coronavirus pandemic marks a fundamental change from previous recessions.
Current Corporate Capex Is Maintenance Only
(Fig. 3) Emission targets require a major boost in net investment.
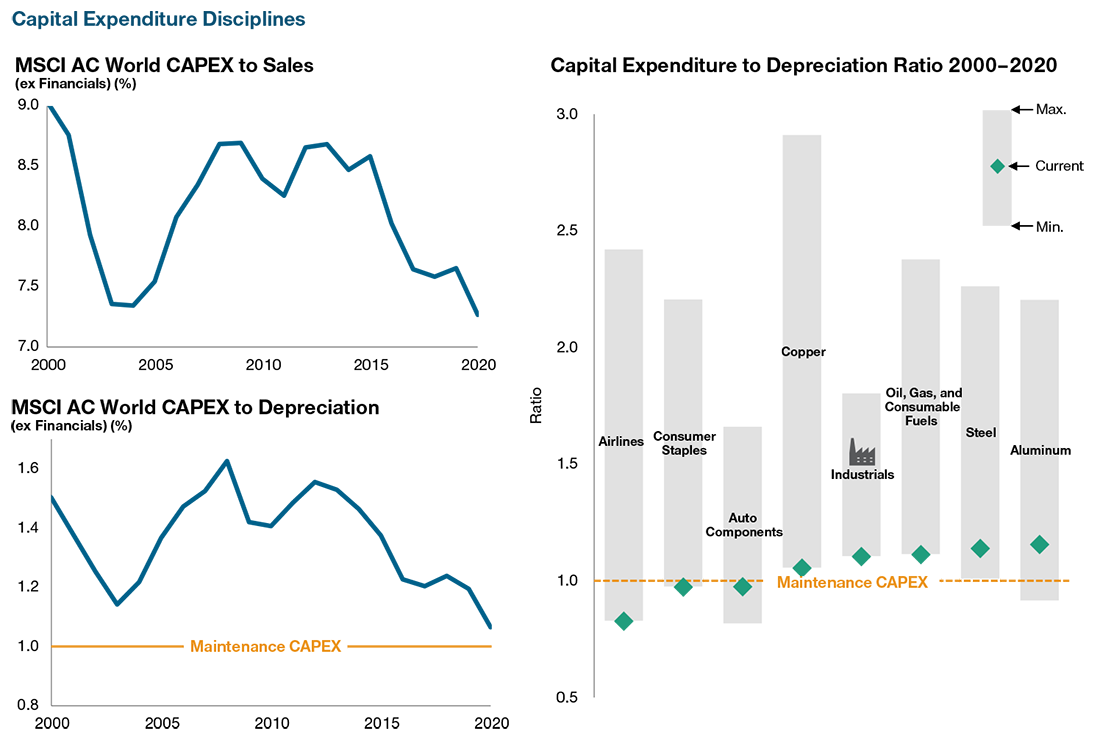
As of December 31, 2020.
Sources: Bloomberg Finance L.P. Financial data and analytics provider FactSet. Copyright 2021 FactSet.
All Rights Reserved. See Additional Disclosures.
Note: The CAPEX to Depreciation ratio divides a company’s capital expenditures by its depreciation. A ratio above 1.0 indicates that the company’s asset base is growing over time.
Post‑COVID‑19 Stimulus Targets Consumers and Green Infrastructure
Stimulus is now being targeted primarily at helping the consumer and boosting green infrastructure rather than being deployed toward supporting corporate and bank balance sheets, as was the case following the collapse of Lehman Brothers in 2008 that triggered the global financial crisis (GFC) and Great Recession. Empirical studies show that fiscal stimulus measures in the U.S. and other developed economies to support the consumer are working as intended and are having a significant multiplier effect on economies. This in turn has led to a significantly faster economic recovery from the pandemic than was seen in 2009 after the GFC. We believe that a faster global economic recovery, in turn, can be expected to provide underlying support for the value style of investing (see Figure 4).
For example, by March 2021, U.S. consumer goods spending (almost one‑third of the global total) had risen to a level 9% above its pre‑COVID‑19 trend, a big enough shock to drive a global recovery in demand. In that month, U.S. households saw their biggest ever increase in average monthly incomes (21%) as they received their USD 1,400 bank checks under President Joe Biden’s American Rescue Plan. In the past year, U.S. households have accumulated an estimated USD 2 trillion of excess savings, some of which is very likely to be spent during the next year or two.
Besides fiscal stimulus, post‑COVID‑19 recoveries are also supported by the extremely accommodative monetary policies implemented by major central banks. For the first time since quantitative easing (QE) began, we are seeing strong real growth rates in M2—or broad money supply—in the U.S., Europe, and Japan. In our view, the emerging markets are well positioned to benefit as global growth should pick up in response to such strong policy stimulus. China, in particular, has been a big beneficiary of the stimulus‑related increase in U.S. consumer goods spending, reflected in merchandise exports from China that are currently around 20% above their pre‑COVID‑19 levels.1
U.S. Real GDP Forecast to Grow Strongly Over 2021–2023
(Fig. 4) Above‑trend GDP growth should be value‑supportive.
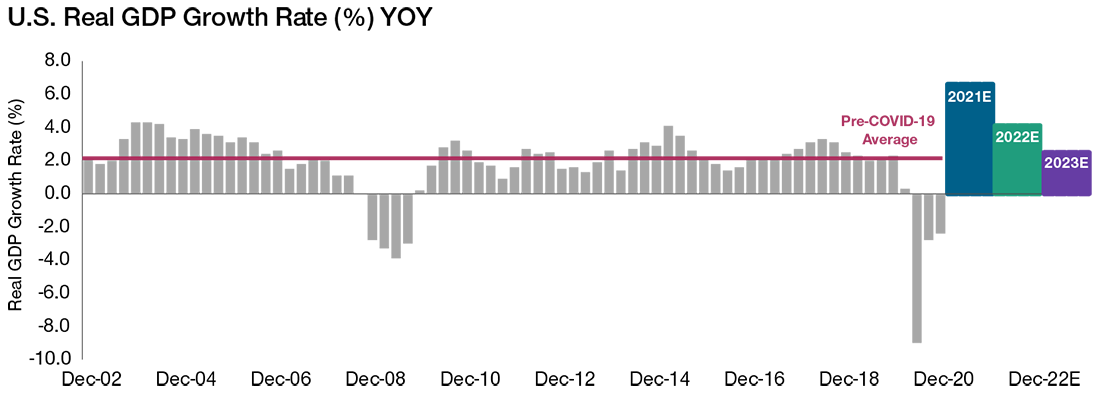
Sources: Bloomberg Finance L.P. CBO Economic Forecast for the U.S. Economy, June 9, 2021 (2023 estimate=2.5%). See Additional Disclosures.
YoY= Year-Over-Year. E= Estimates.
Actual future outcomes may differ materially from estimates.
Stars Appear Aligned for Value Investors
Looking at the way in which the global economic environment is currently changing, there are a number of conditions today that would appear to favor a further rotation toward value. Historically, periods of larger fiscal deficits and strong real GDP growth have often been associated with periods of value outperformance. Earnings per share (EPS) growth is another key factor for value versus growth, with the growth style of investing naturally doing better in periods when earnings were scarce. Currently, the consensus bottom‑up forecasts for emerging markets EPS growth in 2021 and 2022 are 50.1% and 10.2% (MSCI EM Free Index, as at July 5, 20212), respectively, indicating that we have entered an “earnings rich” environment that we believe ought to favor value over growth.
"...some believe the acceleration of new technologies triggered by the pandemic could usher in a period of higher productivity."
Interest rates are another factor to consider. Historically, real rates have shown an inverse relationship with value versus growth. As monetary policy in the U.S. and other countries begins to normalize next year, many analysts expect real interest rates to rise, which should also favor value. Lastly, some believe the acceleration of new technologies triggered by the pandemic could usher in a period of higher productivity. Such periods have tended to favor value rather than growth, as higher productivity, in turn, can be expected to result in stronger growth in earnings.
-
1 As of Q1 2021, Bureau of Economic Analysis.
2 Actual future outcomes may differ materially from estimates.
-
Additional Disclosures
Bloomberg Index Services Limited. BLOOMBERG® is a trademark and service mark of Bloomberg Finance L.P. and its affiliates (collectively “Bloomberg”). BARCLAYS® is a trademark and service mark of Barclays Bank Plc (collectively with its affiliates, “Barclays”), used under license. Bloomberg or Bloomberg’s licensors, including Barclays, own all proprietary rights in the Bloomberg Barclays Indices. Neither Bloomberg nor Barclays approves or endorses this material, or guarantees the accuracy or completeness of any information herein, or makes any warranty, express or implied, as to the results to be obtained therefrom and, to the maximum extent allowed by law, neither shall have any liability or responsibility for injury or damages arising in connection therewith.
Financial data and analytics provider FactSet. Copyright 2021 FactSet. All Rights Reserved.
MSCI and its affiliates and third party sources and providers (collectively, “MSCI”) makes no express or implied warranties or representations and shall have no liability whatsoever with respect to any MSCI data contained herein. The MSCI data may not be further redistributed or used as a basis for other indices or any securities or financial products. This report is not approved, reviewed, or produced by MSCI. Historical MSCI data and analysis should not be taken as an indication or guarantee of any future performance analysis, forecast or prediction. None of the MSCI data is intended to constitute investment advice or a recommendation to make (or refrain from making) any kind of investment decision and may not be relied on as such.
Important Information
Call 1-800-225-5132 to request a prospectus or summary prospectus; each includes investment objectives, risks, fees, expenses, and other information you should read and consider carefully before investing.
This material is provided for informational purposes only and is not intended to be investment advice or a recommendation to take any particular investment action.
The views contained herein are those of the authors as of August 2021 and are subject to change without notice; these views may differ from those of other T. Rowe Price associates.
The fund is subject to market risk, as well as risks associated with unfavorable currency exchange rates and political economic uncertainty abroad. International investments can be riskier than U.S. investments due to the adverse effects of currency exchange rates, differences in market structure and liquidity, as well as specific country, regional, and economic developments. These risks are generally greater for investments in emerging markets. The value approach to investing carries the risk that the market will not recognize a security’s intrinsic value for a long time or that a stock judged to be undervalued may actually be appropriately priced.
This information is not intended to reflect a current or past recommendation concerning investments, investment strategies, or account types, advice of any kind, or a solicitation of an offer to buy or sell any securities or investment services. The opinions and commentary provided do not take into account the investment objectives or financial situation of any particular investor or class of investor. Please consider your own circumstances before making an investment decision.
Information contained herein is based upon sources we consider to be reliable; we do not, however, guarantee its accuracy.
Past performance is not a reliable indicator of future performance. All investments are subject to market risk, including the possible loss of principal. All charts and tables are shown for illustrative purposes only.
T. Rowe Price Investment Services, Inc.
© 2021 T. Rowe Price. All Rights Reserved. T. ROWE PRICE, INVEST WITH CONFIDENCE, and the Bighorn Sheep design are, collectively and/or apart, trademarks of T. Rowe Price Group, Inc.