


- On Target Date Investing
- How We Design a Blend Solution for Target Date Investors
- Mixing active and passive investments in a target date solution.
- 2021-07-22 16:15
- Key Insights
-
- We are committed to delivering successful retirement outcomes through a range of target date solutions for our clients to pursue their needs and objectives.
- Our blend target date funds are designed with a goal of delivering a lower fee profile and reduced tracking error with the benefits of our approach to active management.
- We believe the pursuit of lower costs must be balanced with the need for broad diversification and the potential for excess returns.
Given our leadership in the target date marketplace, we have a strong commitment to research and innovation to pursue investors’ evolving needs. Our target date suite is built on the principle that investor preferences should drive design. For that reason, we offer an array of solutions to meet the range of needs we know exist in the market.
A number of plan sponsors have sought out target date products that offer lower fees and reduced tracking error.1 Importantly, they are seeking solutions from providers that can restrain costs but offer a full opportunity set of asset classes that can potentially generate excess returns and greater portfolio growth.
In addition to delivering a strategy that combines the value of active management with the lower costs of passive management, we believe our approach to a blend target date strategy offers investors:
- A thoughtful glide path design tailored to help support investors’ objectives, which seeks to balance risk and return potential in line with our research on participant preferences and behavior.
- A portfolio with enhanced diversification in asset categories that we believe can only be adequately achieved through active management.
- A suite of strong underlying building blocks, including actively managed components with track records of delivering excess returns over the long term.2
- A robust tactical allocation decision‑making process that rigorously assesses market risks and opportunities.
- An experienced team that has managed target date strategies through multiple market cycles.
Solving for Client Needs
Plan sponsors often have unique needs and specific objectives in their selection of target date offerings. Lower cost solutions that couple the benefits of active and passive management are among them. We recognize that some passive investments can provide efficient capital market exposure in select sectors while also delivering significant cost reduction. Importantly, however, we believe our actively managed portfolios can generate excess returns and diversification through exposure to market segments in which passive management might not drive desired outcomes.
The primary goal of our blended approach is consistent with that of our existing suite of target date offerings: to balance providing support for lifetime income with reducing volatility near retirement through a risk‑aware design. We firmly believe that a fully active approach presents the greatest opportunity to generate excess returns, but we also recognize that, for some, this goal must be balanced alongside other considerations. To that end, we sought to design a solution to meet plan sponsors’ needs without sacrificing participants’ outcomes.
Building a Blend Solution
We sought to design a target date strategy that blends T. Rowe Price passive and actively managed investments with an aim to deliver a lower fee profile and reduced tracking error while maintaining many of the benefits of active management. Through an iterative evaluation process, we explored the trade‑offs between our active and passive strategies in terms of their potential impact on a range of outcomes, such as cost, excess return potential, and diversification, among other factors.
"...we explored the trade‑offs between our active and passive strategies in terms of their potential impact on a range of outcomes, such as cost, excess return potential, and diversification, among other factors."
The goal of a manager of a passive strategy is to replicate the performance of a benchmark or index the strategy is intended to track. The ease of replicating an index varies meaningfully across asset classes. Tracking error is a useful measure of how closely portfolios track their benchmark. In certain market segments, like U.S. large‑cap equities, tracking error of passive investments tends to be lower, as it is relatively easier for passive managers to purchase the securities that compose the index in the proportions needed to try to replicate index returns. However, in other areas, particularly in fixed income, tracking error has tended to be a more notable challenge.
The Credit Suisse High Yield Index, for example, consists of over 1,300 distinct securities from multiple sectors.3 Many of these bonds are issued in relatively limited quantities and may trade infrequently, or not at all, in the secondary market. Further, new issuance, maturities, credit rating changes, and redemptions can continuously alter the makeup of a bond index, thereby increasing the difficulty of fully replicating the index and potential for tracking error.
Fixed income and equity portfolios have divergent characteristics and are impacted by different factors, particularly when considering the implementations of a blended approach between active and passive investments. For that reason, we considered our approach to the broad asset classes separately.
Our Active Approach Offers Favorable Diversification
(Fig. 1) Regional diversification
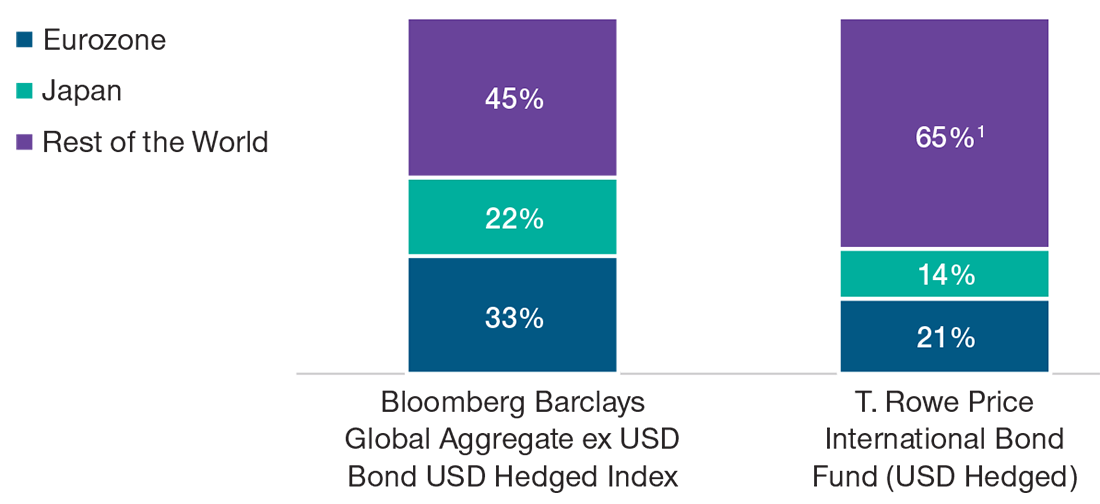
As of June 30, 2021.
Figures are rounded.
Source: T. Rowe Price. Source for Bloomberg Barclays Index data: Bloomberg Index Services Ltd. (see Additional Disclosures).
1 Reserves are included in this figure, which represented 10.46% of total net assets of the fund as of June 30, 2021.
Fixed Income—Improved Diversification
We believe in broad diversification4 within fixed income and, therefore, have implemented allocations across both core and diversifying fixed income sectors in our funds. As part of our design process, we evaluated the trade‑offs of active and passive investments across each fixed income sector in which we invest. For each sector, we evaluated a passive investment’s ability to achieve efficient exposure with low tracking error as well as the attractiveness of gaining that exposure passively.
While passive investment strategies within certain fixed income market segments appear to face challenges gaining efficient exposure, our research indicates passive can be appropriate in other market segments due to the relative ease of benchmark replication and reasonably well‑contained tracking error within those sectors. Based on our analysis, we employ passive investments within the U.S. investment‑grade and U.S. Treasury sleeves of our target date funds. Additionally, we believe passive exposure to these sectors is more prudent given their high credit quality. This allocation to passive fixed income investments also enables us to maintain an allocation to active equity while maintaining a similar mix of our actively managed and passive funds across our portfolios.
In more specialized fixed income sectors, our analysis suggests that an active management approach can be preferable, as index returns can be more challenging to replicate through passive portfolios. In these sectors—such as high yield and emerging markets debt—passive managers may not be able to purchase and hold some benchmark securities at appropriate weights, and there can be heightened liquidity risks. As a result, tracking error for a passive strategy in these sectors can comparably be as high as an active strategy, and performance may fail to appropriately track the stated benchmark.
"Beyond the potential for inefficiency and high tracking error, we found that accurate index exposure in certain sectors may produce unfavorable outcomes."
Beyond the potential for inefficiency and high tracking error, we found that accurate index exposure in certain sectors may produce unfavorable outcomes. In some cases, the securities that dominate particular indexes may have potentially unattractive qualities:
- Within high yield debt, index representation tends to skew toward the most highly leveraged issuers. This can expose investors to greater default risk and can also create sector concentrations.
- In emerging markets debt, benchmark representation is typically limited to sovereign issues, which reduces the opportunity set available to investors.
- In international developed debt markets, some indexes tend to skew toward a high concentration of issuers in a limited number of countries, which can increase idiosyncratic risk.
We believe target date strategies should have strategic exposure to these sectors, which should provide important, long‑term diversification benefits. In our view, exposure to these sectors can be best achieved through an active management approach.
Incorporating Passive Fixed Income Strategies
(Fig. 2) Active and passive investments in fixed income
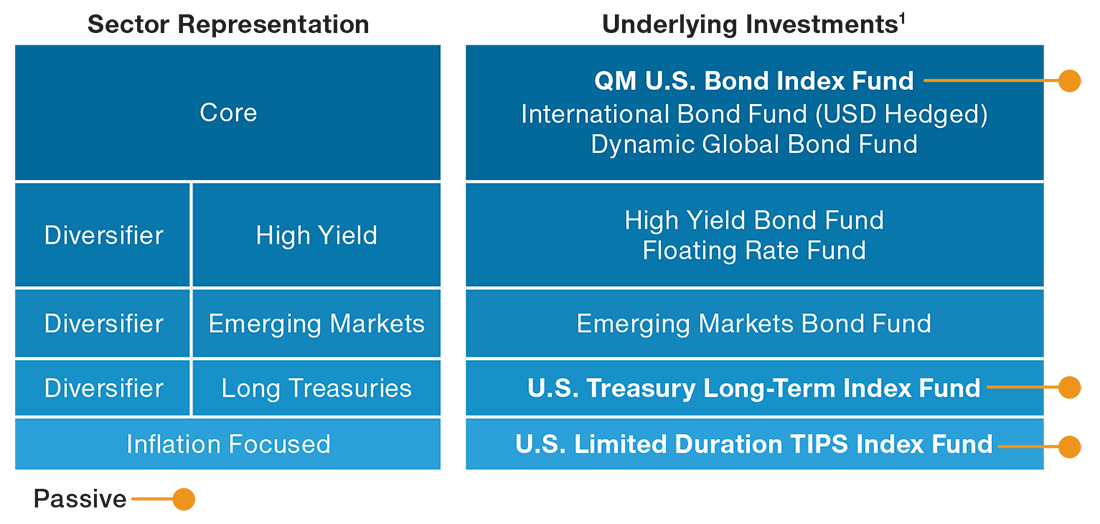
Source: T. Rowe Price.
1 Underlying investments of the T. Rowe Price Retirement Blend Funds.
Active Management Maximizing the Potential for Excess Returns
(Fig. 3) Average annualized excess returns (net of fees)
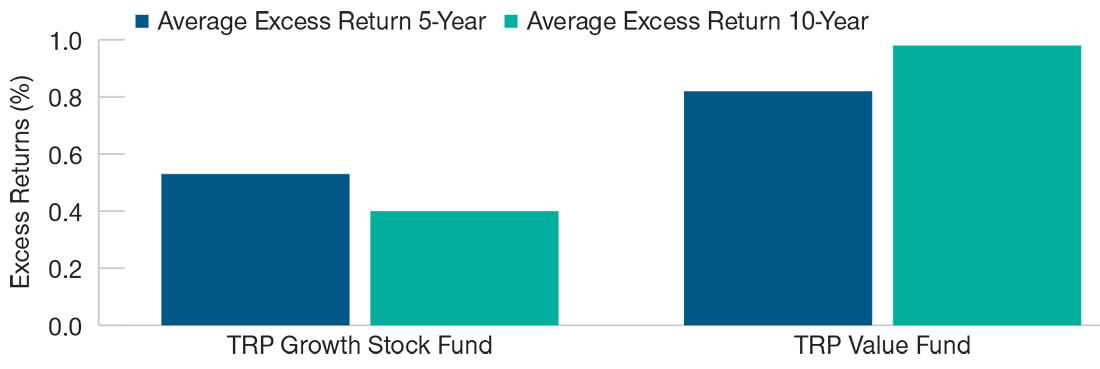
For illustrative purposes only. Please see Standardized Performance table at the end for additional important information.
Current performance may be higher or lower than the quoted past performance, which cannot guarantee future results. Share price, principal value, and return will vary, and you may have a gain or loss when you sell your shares.
Average annual total return figures include changes in principal value, reinvested dividends, and capital gain distributions. To obtain the most recent month‑end performance, please visit our website or contact a T. Rowe Price representative at 1‑800‑225‑5132.
The benchmark used for the Growth Stock Fund excess returns calculation is the Russell 1000 Growth Index, which was used because of its similar style focus. The benchmark for the Value Fund is the Russell 1000 Value Index. The excess returns show how the fund has performed compared to it’s benchmark.
As of June 30, 2021. Data is calculated on a monthly basis over a 20 year period and is based on returns over rolling 5- and 10-year periods.
Source: T. Rowe Price, Russell (see Additional Disclosure).
Equities—Potential for Excess Returns
Among equities, we found that the appropriateness of passive and active vehicles similarly varied across market segments and styles. In core allocations to U.S. and international developed markets equities, we determined that passive allocations could achieve efficient market exposure while restraining cost.
However, we concluded that—given the magnitude of potential excess returns—desirable potential outcomes were most supported by combining these passive allocations with our active allocations to narrower, style‑based segments. Specifically, we believe our active capabilities in growth‑ and value‑focused segments in the U.S. and international developed markets provide opportunities to maximize potential excess cost‑adjusted returns that may deliver value for plan participants.
For instance, passive investments in U.S. equities present opportunities to gain efficient market exposure at lower cost and minimal tracking error. We believe that a purely passive investment in the segment, however, could limit our ability to pursue excess returns given U.S. equity is generally our largest allocation across the glide path.5 In particular, our target date portfolios maintain a sizable allocation to U.S. large‑cap equities throughout the glide path, and we believe the magnitude of potential value added from our active strategies within this allocation outweighs the lower cost of a passive alternative.6 Accordingly, we decided to incorporate the actively managed U.S. growth and U.S. value components in our blended target date funds. T. Rowe Price (TRP) funds in these categories historically have outperformed their respective style‑specific benchmarks. Given our sizable allocation and track record of generating excess returns net of fees within U.S. large‑cap equities, we believe it is prudent to utilize a degree of active management within the space. Our emphasis is on participant outcomes, and we have a high conviction on maintaining active allocations where we believe we can add significant value.
"Our emphasis is on participant outcomes, and we have a high conviction on maintaining active allocations where we believe we can add significant value."
While efficient passive market exposure is available in certain market segments, we feel that investment opportunities in a number of sectors could also be enhanced though our active management approach. We believe that passive options in emerging markets equities are less desirable, as they are generally viewed as inefficient markets and because some indexes may skew heavily toward concentration in a few countries. Our suite of target date solutions also maintains an allocation to real assets equities, which can enhance diversification and provide a potential hedge against inflation. In our view, the universe of passive investments does not offer an adequate alternative for this allocation.
Incorporating Passive Equity Strategies
(Fig. 4) Active and passive investments in equities
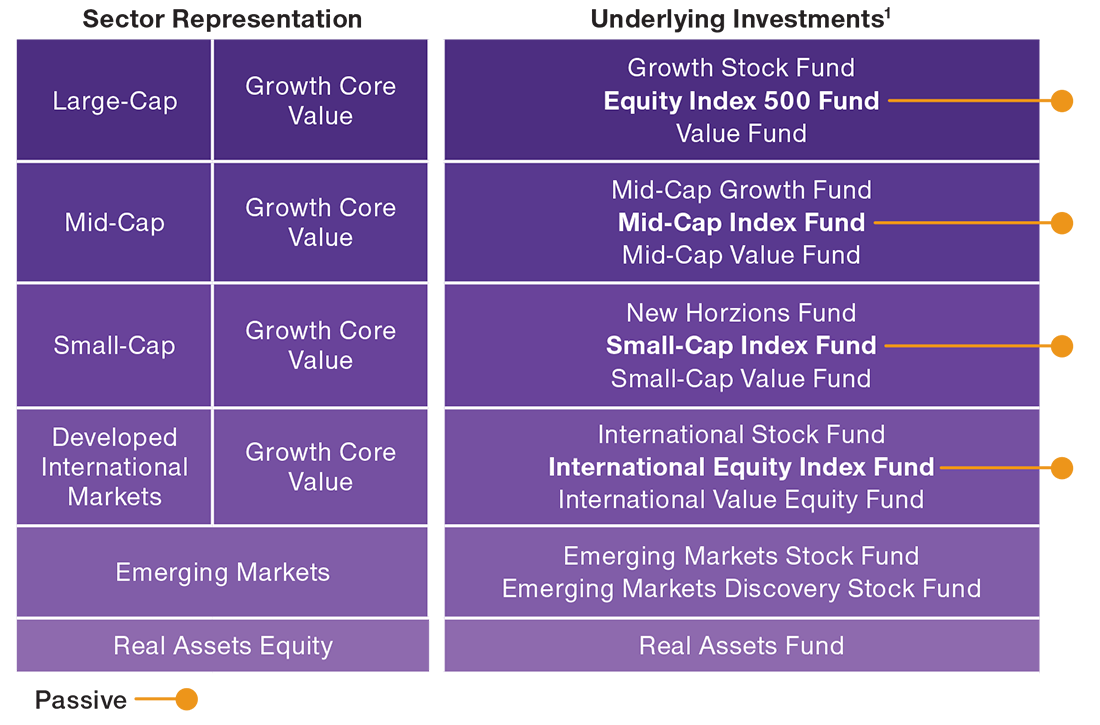
Source: T. Rowe Price.
1 Underlying investments of the T. Rowe Price Retirement Blend Funds.
Conclusion
By adding blend mutual funds to our suite of target date solutions, we believe we can offer plan sponsors a unique alternative that stands out from the existing universe of investment options. The integration of active and passive strategies in our blended solution offers investors the potential for lower costs and the potential to benefit from excess returns driven by fundamental research.
-
1 Tracking error is a measure of how closely portfolios track their benchmarks.
2 Most of the actively managed funds utilized by the Retirement Blend Funds outperformed their respective benchmarks over the majority of rolling 5- and 10- year periods ended June 30, 2021 based on total returns of individual actively managed funds. Past performance is not a reliable indicator of future results. Other time periods may yield different results. Future performance of the Retirement Blend Funds, which incepted on July 26, 2021, and their underlying funds, may differ significantly from the performance described.
3 As of June 30, 2021.
4 Diversification cannot assure a profit or protect against loss in a declining market.
5 Please refer to Figure 3 to see average annualized excess returns for the T. Rowe Price Growth Stock Fund and Value Fund.
6 Within our target date funds, the allocation to U.S. large‑cap equities ranges between 52% and 16% as of June 30, 2021. The allocation is largest in portfolios furthest from retirement age and decreases over time.
Standardized Performance
Periods Ended June 30, 2021
Annualized |
||||
| 1 Year | 3 Years | 5 Years | 10 Years | |
| Growth Stock Fund (Net of Fees) | 45.16%3 | 23.07% | 24.19% | 17.96% |
| S&P 500 Index1,2 | 40.79 | 18.67 | 17.65 | 14.84 |
| Russell 1000 Growth Index1 | 42.50 | 25.14 | 23.66 | 17.87 |
| Value Fund (Net of Fees) | 52.433 | 15.40 | 14.20 | 12.90 |
| Russell 1000 Value Index1 | 43.68 | 12.42 | 11.87 | 11.61 |
Performance data quoted represents past performance and is not a reliable indicator of future performance. Investment return and principal value will fluctuate so that an investor’s shares, when redeemed, may be worth more or less than their original cost. Current performance may be lower or higher than the performance data quoted. To obtain the most recent month-end performance, visit troweprice.com.
The Growth Stock Fund’s expense ratio as of the most recent prospectus was 0.64%. See the prospectus for details.
The Value Fund’s expense ratio as of the most recent prospectus was 0.77%. See the prospectus for details.
Sources: Standard and Poor’s and Russell (see Additional Disclosures).
Average annual total return figures include changes in principal value, reinvested dividends, and capital gain distributions.
1 Index return figures shown with gross dividends reinvested.
2 The benchmark as shown in the most recent prospectus is the S&P 500 Index.
3 Investors should note that the fund’s short-term performance is highly unusual and unlikely to be sustained.
Performance provided is for illustrative and informational purposes only. It is intended to illustrate the research and decisions behind the creation of the Retirement Blend Funds. The performance provided does not represent the performance of the Retirement Blend Funds. The Retirement Blend Funds incepted on July 26, 2021 and do not have performance histories prior to this date. Future performance of the Retirement Blend Funds and the underlying funds may differ significantly from the performance shown in this material.
We have managed the same retirement blend strategy in the form of non-public commingled accounts since February 2018.
-
Additional Disclosures
Bloomberg Index Services Limited. BLOOMBERG® is a trademark and service mark of Bloomberg Finance L.P. and its affiliates (collectively “Bloomberg”). BARCLAYS® is a trademark and service mark of Barclays Bank Plc (collectively with its affiliates, “Barclays”), used under license. Bloomberg or Bloomberg’s licensors, including Barclays, own all proprietary rights in the Bloomberg Barclays Indices. Neither Bloomberg nor Barclays approves or endorses this material, or guarantees the accuracy or completeness of any information herein, or makes any warranty, express or implied, as to the results to be obtained therefrom and, to the maximum extent allowed by law, neither shall have any liability or responsibility for injury or damages arising in connection therewith.
London Stock Exchange Group plc and its group undertakings (collectively, the “LSE Group”). © LSE Group 2021. FTSE Russell is a trading name of certain of the LSE Group companies. “Russell®” is a trade mark of the relevant LSE Group companies and is used by any other LSE Group company under license. All rights in the FTSE Russell indexes or data vest in the relevant LSE Group company which owns the index or the data. Neither LSE Group nor its licensors accept any liability for any errors or omissions in the indexes or data and no party may rely on any indexes or data contained in this communication. No further distribution of data from the LSE Group is permitted without the relevant LSE Group company’s express written consent. The LSE Group does not promote, sponsor or endorse the content of this communication. The LSE Group is not responsible for the formatting or configuration of this material or for any inaccuracy in T. Rowe Price Associates’ presentation thereof.
The S&P 500 Index is a product of S&P Dow Jones Indices LLC, a division of S&P Global, or its affiliates (“SPDJI”), and have been licensed for use by T. Rowe Price. Standard & Poor’s® and S&P® are registered trademarks of Standard & Poor’s Financial Services LLC, a division of S&P Global (“S&P”); Dow Jones® is a registered trademark of Dow Jones Trademark Holdings LLC (“Dow Jones”). T. Rowe Price’s product is not sponsored, endorsed, sold or promoted by SPDJI, Dow Jones, S&P or their respective affiliates, and none of such parties make any representation regarding the advisability of investing in such product nor do they have any liability for any errors, omissions, or interruptions of the S&P 500 Index.
The principal value of the target date strategies are not guaranteed at any time, including at or after the target date, which is the approximate year an investor plans to retire (assumed to be age 65) and likely stop making new investments in the fund. If an investor plans to retire significantly earlier or later than age 65, the funds may not be an appropriate investment even if the investor is retiring on or near the target date. The fundsʼ allocations among a broad range of underlying T. Rowe Price stock and bond funds will change over time. The funds emphasize potential capital appreciation during the early phases of retirement asset accumulation, balance the need for appreciation with the need for income as retirement approaches, and focus on supporting an income stream over a long‑term post-retirement withdrawal horizon. The funds are not designed for a lump‑sum redemption at the target date and do not guarantee a particular level of income. The funds maintain a substantial allocation to equities both prior to and after the target date, which can result in greater volatility over shorter time horizons.
Diversification cannot assure a profit or protect against loss in a declining market.
Important Information
Call 1‑800‑225‑5132 to request a prospectus or summary prospectus; each includes investment objectives, risks, fees, expenses, and other information you should read and consider carefully before investing.
This material is provided for informational purposes only and is not intended to be investment advice or a recommendation to take any particular investment action.
The views contained herein are those of the authors as of July 2021 and are subject to change without notice; these views may differ from those of other T. Rowe Price associates.
This information is not intended to reflect a current or past recommendation concerning investments, investment strategies, or account types, advice of any kind, or a solicitation of an offer to buy or sell any securities or investment services. The opinions and commentary provided do not take into account the investment objectives or financial situation of any particular investor or class of investor. Please consider your own circumstances before making an investment decision.
Information contained herein is based upon sources we consider to be reliable; we do not, however, guarantee its accuracy.
Past performance is not a reliable indicator of future performance. All investments are subject to market risk, including the possible loss of principal. The value approach to investing carries the risk that the market will not recognize a security’s intrinsic value for a long time or that a stock judged to be undervalued may actually be appropriately priced. Growth stocks are subject to the volatility inherent in common stock investing, and their share price may fluctuate more than that of a income-oriented stocks. Fixed-income securities are subject to credit risk, liquidity risk, call risk, and interest-rate risk. As interest rates rise, bond prices generally fall. Investments in high-yield bonds involve greater risk of price volatility, illiquidity, and default than higher-rated debt securities. International investments can be riskier than U.S. investments due to the adverse effects of currency exchange rates, differences in market structure and liquidity, as well as specific country, regional, and economic developments. These risks are generally greater for investments in emerging markets. All charts and tables are shown for illustrative purposes only.
T. Rowe Price Investment Services, Inc.
© 2021 T. Rowe Price. All Rights Reserved. T. ROWE PRICE, INVEST WITH CONFIDENCE, and the Bighorn Sheep design are, collectively and/or apart, trademarks of T. Rowe Price Group, Inc.