Global multi‑asset portfolios at T. Rowe Price start from a diversified position between the value and growth investment styles. We deviate from the neutral position based on our tactical asset allocation views for the next six to 18 months. These views are defined using a wide range of quantitative and qualitative inputs. For the first time in about 10 years, we began to overweight value versus growth in September 2020. Since then, the value style outperformed the growth style significantly. One way to measure this rotation from growth to value is to look at the short‑term divergence of factor returns. We define a factor portfolio for value and growth as a long‑short portfolio (please see below): The long position is the top quintile of stocks representing the factor, and the short position is the bottom quintile of stocks representing the factor.
"…we began to overweight value versus growth in September 2020."
DEFINITION OF VALUE AND GROWTH FACTORS
We Use the MSCI World Universe as the Neutral Portfolio in Our Analysis
Value: The return differential of undervalued stocks versus overvalued stocks
The value composite is an equal-weighted average of the market cap-weighted factor performance of enterprise value/earnings before interest, taxes, depreciation, and amortization (EV/EBITDA); enterprise value/sales (EV/Sales); free cash flow yield (FCF Yield); price/book, and price/forward 12-month earnings per share (EPS).
Growth: The return differential of high growth stocks versus low growth stocks
The growth composite is an equal-weighted average of the market cap‑weighted factor performance of forward two‑year EPS growth, forward two-year sales growth, trailing 12-month EPS growth, and trailing 12-month sales growth.
Strong Reversal in Style Factor Return in the Past Six Months
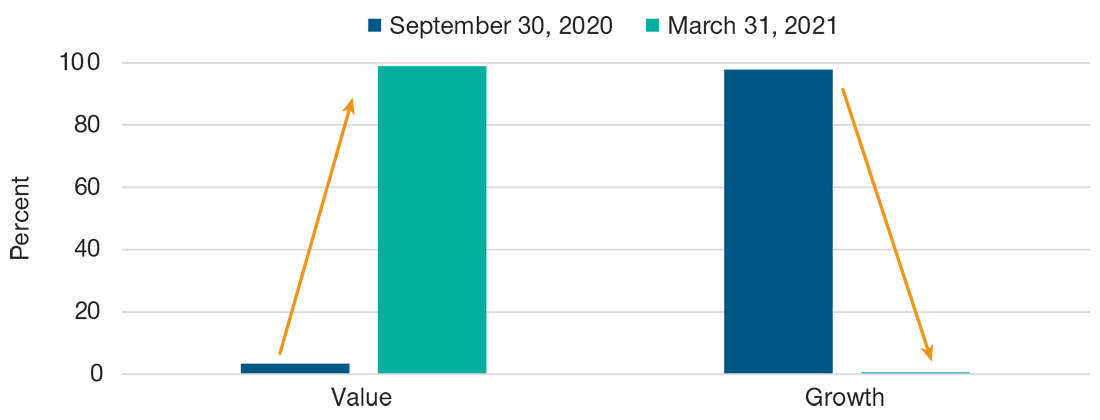
In Figure 1, we calculate rolling six‑month factor returns for both value and growth. We compare the most recent six‑month return with all of the previous six‑month rolling returns since December 2002 (close to 20 years of history). We show the percentile, i.e., how the latest data compare with 220 previous periods of rolling six‑month returns.
This figure shows how extreme the rotation has been in the past six months. Basically, the six‑month return ending in September 2020 for value was among the lowest 3% of six‑month returns for that factor since 2002, while it was the 97% highest return for growth. The following six‑months delivered a completely opposite result: As of March 31, 2021, the latest six‑month return for the value factor was among the best it has ever been since 2002 (99th percentile), while the latest six‑month return for growth was among the worst ever (0.4 percentile).
A natural question for investors to ask now is: Has the value rotation already run its course, or is there still some fuel left in the value tank?
"…we decided to highlight three quantitative reasons why we believe the value rotation is unlikely to be over."
While our decision to overweight value depends largely on fundamental reasons (vaccine rollout, economic reopening, pent‑up demand, earnings rebound, rising yields), we decided to highlight three quantitative reasons why we believe the value rotation is unlikely to be over.
A Record Swing From Growth to Value
(Fig. 1) Factor return percentile–six-month rolling basis
Reason #1—The Valuation Divergence Remains Extreme
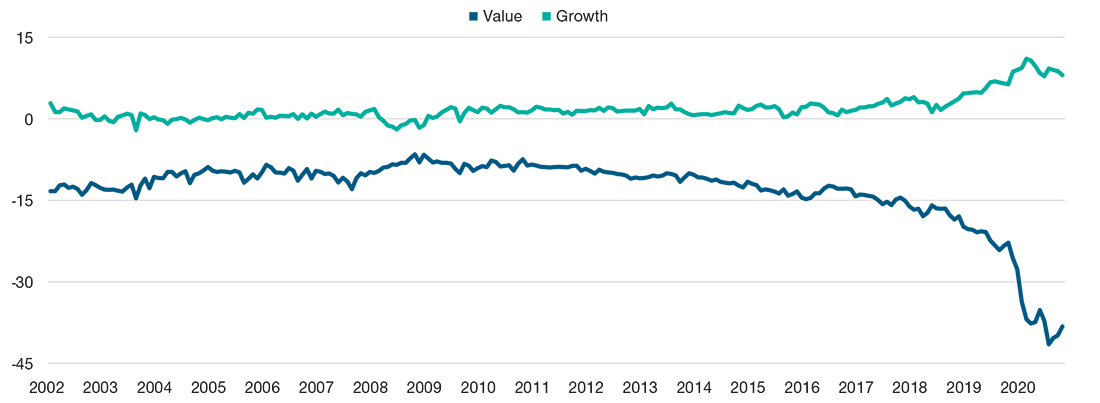
Beside the return, we can also calculate how expensive or cheap each stock is within each factor quintile. In Figure 2, we use the price/earnings (P/E) ratio of each stock. We then calculate the difference between the average P/E ratio of the top stock quintile minus the bottom stock quintile for each factor.
"…the value style could benefit from both a rebound in earnings as well as an increase in P/E multiples."
Let’s focus on the value factor first. It is well understood that the difference of the average P/E ratio between the cheapest stocks (top quintile) and the most expensive stocks (bottom quintile) would always be negative. From 2002 to 2017, we found that this difference has been in a range of between ‑10 to ‑15 in terms of the average P/E ratio difference. Since 2018, this difference has widened significantly to reach a bottom at the end of 2020 around ‑40. This means that the difference in valuation between cheap and expensive stocks has never been that acute since 2002 when our sample begins. Despite the recent rebound in performance for value stocks, the difference between styles remains elevated because the expensive stocks got more expensive at the same time. We believe there is room for this divergence in valuation to further mean revert. This would, in turn, support the value factor as the average P/E ratio would start to catch up with that of the most expensive (growth) stocks. Hence, the value style could benefit from both a rebound in earnings as well as an increase in P/E multiples. Both of which would likely be additive to their future returns.
From the same chart, it is also interesting to note that it is only in the last two years that there has been a difference in valuation between the top quintile of growth stocks (most expensive) and the bottom quintile of growth stocks (least expensive). It used to be that the valuation difference was close to zero, on average. Since 2018, however, a valuation premium has emerged in the top quintile of growth stocks. There is room for this divergence to also mean revert toward zero. Growth investors, in this case, should considering avoiding the most expensive growth stocks and consider rotating back to the growth stocks with the cheapest attributes. Separately, we noticed that, among U.S. large-cap stocks, more than 30% currently have a P/E ratio that is higher than 50.1 This number has not been that high since the tech bubble in 2000/2001. Either the P has to come down or the E has to grow as this level of P/E doesn’t look sustainable if history is any guide.
Valuation Spreads Between Top and Bottom Quintiles
(Fig. 2) Average P/E ratio spread for the growth and value factors
Reason #2—Follow the Money
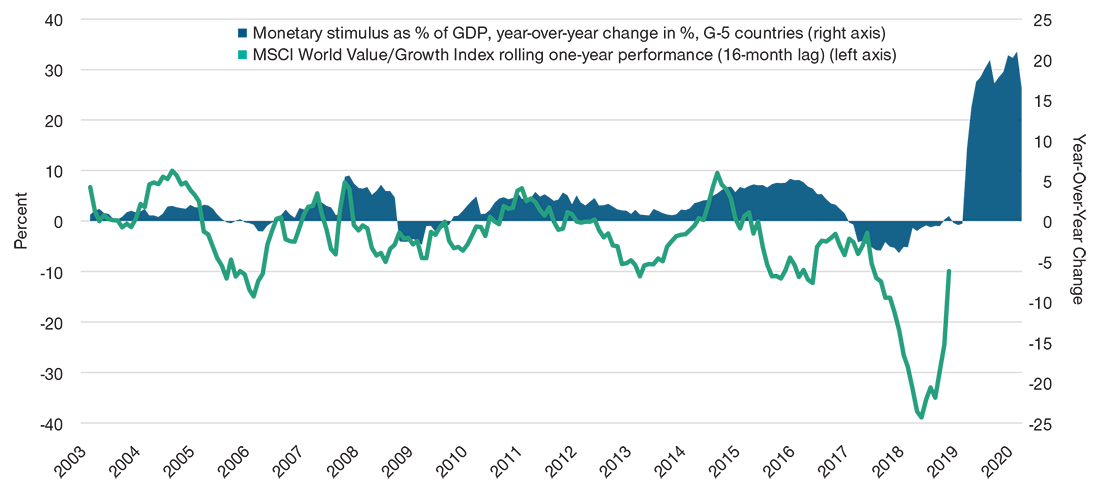
Our research finds that monetary impulse is a lead indicator for certain financial market returns. For example, the monetary impulse seems to lead the value/growth return by about 16 months.
In Figure 3, we plot two data series. The shaded area is the monetary impulse of five large economies (U.S., EU, UK, Japan, and China) expressed as a percentage of their gross domestic product (GDP). The green line is the 12‑month rolling return of the MSCI World Value Index versus the MSCI World Growth Index, with a 16‑month lag.
From Figure 3, it seems that an increase in the monetary impulse leads an outperformance of value over growth. From 2003 to 2019, the variations in these two data series have been in the ±10% range. It’s interesting to note that the monetary impulse that started in late 2019, and which was greatly amplified by the response to the COVID‑19 crisis in 2020, completely outpaced previous impulse episodes: the year‑on‑year growth is in the 30% range. At the same time, the magnitude of underperformance of value versus growth was unprecedented, with a low of close to ‑40% in the third quarter of 2020.2
"If history is any guide, we might expect the value versus growth 12-month return to reach at least 10% in the coming months…"
Since then, the 12‑month rolling return of value versus growth recovered sharply, following the rebound in monetary impulse by 16 months. At ‑10% as of March 31, 2021, it is only now catching up with the lower band of the historical range. If history is any guide, we might expect the value versus growth 12‑month return to reach at least 10% in the coming months and even exceed that threshold given the unprecedented magnitude of the monetary impulse in 2020. On this metric, we can argue that the value rotation is perhaps only half way through.
Record Stimulus Implies Value Rotation Can Continue
(Fig. 3) Monetary stimulus and value/growth performance
Reason #3—What About Rising Yields?
Arguably, the most heated debate in financial markets these days is over the inflation outlook. A rise in inflation expectations has implications for the yield environment, future monetary policy, and market sentiment.
Not only will inflation and interest rates drive risk‑on versus risk‑off sentiment more than usual, but they will also likely drive the recovery trade as reflected in the returns of value versus growth. To try to get the rates regime call right, we must separate the nominal rate into the real rate and inflation expectations. These two components have often moved in opposite directions because they can react differently to the macro environment. Inflation may be more sensitive to commodity prices, supply and demand bottlenecks, or currency depreciation. Real rates are more likely to react to growth expectations.
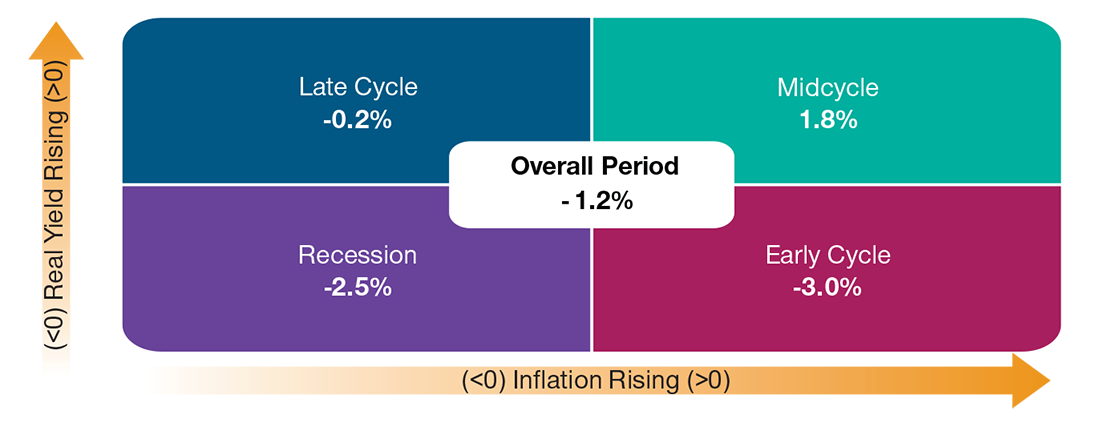
We can decompose previous market periods or regimes depending on the inflation and the real rate changes. For example, if both are positive as in the current environment, we define this as being “midcycle.” To the contrary, if both are dropping, we define this as a recession environment. In Figure 4, we use U.S. inflation and real rates data to define regimes and look at weekly returns of value versus growth.
Value Outperformed When Inflation and Real Yields Rose
(Fig. 4) Returns of value versus growth conditioned on real rate/inflation regime
Over the reference period, value underperformed growth on average. But the only periods when value outperformed growth was during weeks where both inflation and real rates changes were positive at the same time: This is the midcycle regime on the top right. We believe this is the environment we are most likely to be in for the next six to 12 months as both inflation and growth expectations get reset higher as the global economy recovers from the pandemic. We believe this scenario justifies maintaining an overweight to value if one expects inflation and real rates to increase in the near future.
We believe there are solid fundamental reasons to tactically overweight value versus growth. In this study, we outline three quantitative reasons to support this view. Going forward, we will continue to monitor the divergence of valuation between cheap and expensive stocks, the monetary impulse, and the changes in both inflation and real yields.