


- On U.S. Equity
- Growth Stocks Unlikely to Be Troubled by Short‑Term Inflation Spike
- A sharp rise in U.S. inflation is not expected to last.
- 2021-07-23 20:16
- Key Insights
-
- The recent surge in U.S. inflation is creating uncertainty for investors used to the low inflation/low interest rate landscape that has prevailed for decades.
- For growth companies, in particular, high inflation and the prospect of rising interest rates represent a challenging near‑term environment.
- However, we do not anticipate U.S. inflation remaining elevated longer term. As such, our positive outlook for growth companies remains unchanged.
Optimism surrounding the nascent U.S. economic recovery following one of the deepest downturns in history has been tempered in recent months by a sharp rise in inflation. Annual consumer price index (CPI) inflation in the U.S. soared to 5.4% in June—well above the Federal Reserve’s 2% target—raising concerns that earlier‑than‑anticipated policy action might be necessary. This prospect has prompted a rise in equity market volatility, with growth‑oriented stocks coming under particular pressure.
U.S. CPI Inflation in June 2021—the highest level since 2008.
With the so‑called “great rotation” from growth to value‑oriented stocks already playing out in 2021, the emergence of inflationary pressure adds to a challenging near‑term landscape for growth companies. It seems reasonable to think that inflation readings are likely to be more uneven going forward, and potentially spanning a wider range than we have been accustomed to in recent years. Importantly, however, we do not anticipate inflation moving to a consistently higher level over the longer term. As such, we maintain a positive longer‑term outlook for growth companies and their ability to grow free cashflows over time.
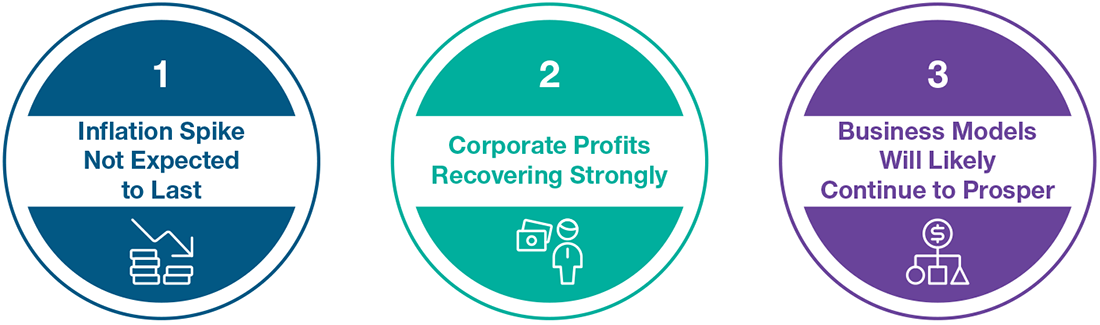
Inflation Spike Not Expected to Last
The recent surge in U.S. inflation to the highest levels since 2008 is an understandable source of uncertainty for investors who have grown accustomed to the low inflation/low interest rate landscape that has prevailed for two decades. For growth companies, the possibility of rising interest rates has particularly worrying implications as future cash flows will be discounted at a higher rate, impacting company valuations today.
Three Factors Shaping the Outlook for Growth Stocks
That said, an uptick in inflation was not completely unexpected. This was always a risk once the government and central bank stimulus measures began to flow through to the economy as it progressively reopened for business. Savings levels have risen during the pandemic, and as the rollout of the coronavirus vaccine broadens to a greater proportion of the population, pent‑up demand is being released. We believe this higher‑trend inflation is likely to continue over the next 12–18 months, before settling back around the Fed’s target 2% level on a longer‑term basis. This is in line with what financial markets are currently indicating, with expectations of around 2% CPI inflation similarly being priced in over the longer term.
Expectations for Longer‑Term Inflation
Data on inflation expectations appear to support our view that the spike will be temporary. It does not appear that the markets are anticipating a sustained level of higher inflation. The 10‑year break‑even inflation rate is a direct indication of U.S. inflation expectations over the next 10 years. The chart below shows a steep rise in the break‑even rate from the lows of early 2020, which initially appears to be a significant shift. However, the break‑even rate has merely moved back up to around 2% expected inflation—well below today’s 5.4% level.
A similar message can be gleaned from the equity market. Given the severity of the market sell‑off that occurred in the first quarter of 2020, the U.S. equity recovery has been nothing short of spectacular. While volatility has increased in recent months, the S&P 500 Index is up 14.4% year‑to‑date (as of June 30, 2021).1
Longer‑Term U.S. Inflation Expectations Appear Well Anchored
(Fig. 1) 10‑year Treasury break‑even inflation rates
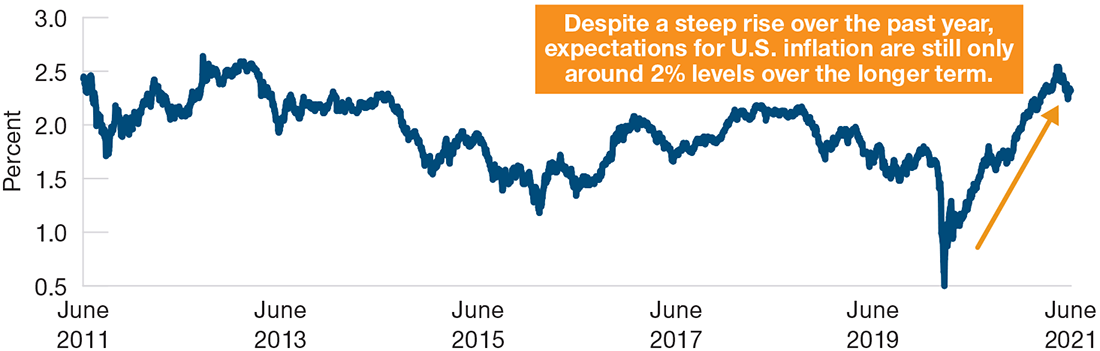
As of June 30, 2021.
The 10‑year break‑even inflation rate is a measure of U.S. inflation expectations. It represents the difference in yield between 10‑Year U.S. Treasury (Constant Maturity) Bonds and 10‑Year U.S. Treasury Inflation‑Indexed (Constant Maturity) Bonds.
Source: Federal Reserve Bank of St. Louis. Data analysis by T. Rowe Price.
Corporate Profits Recovering Strongly
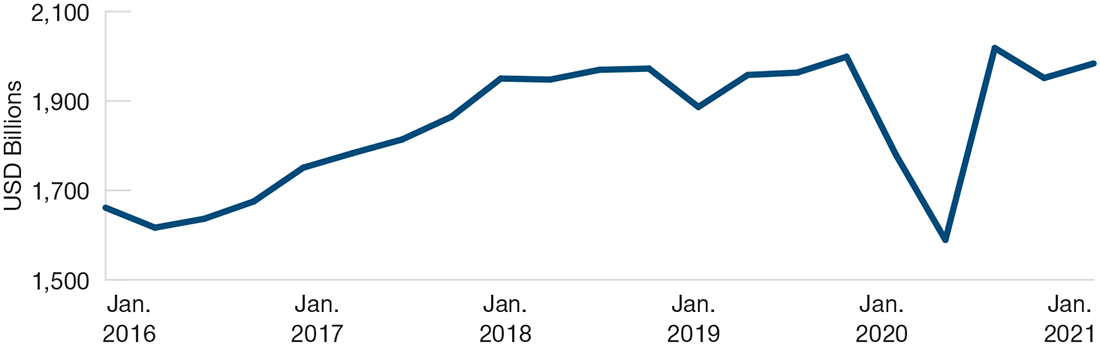
At the corporate level, profits have also recovered well in recent quarters, having fallen sharply during the first quarter of 2020. The recovery has been helped in no small way by the substantial stimulus provided during the past 12 months. Clearly, this level of support cannot continue long term, which begs the question: How sustainable is the recent recovery in profits? In the near term, we are anticipating a sharp cyclical recovery in the U.S., with estimated gross domestic product growth of around 6% per annum2 assuming the recovery continues to fully take hold. Such a rapid rate of expansion is not sustainable, but for the next 12–18 months, at least, this potential growth should help underpin the ongoing recovery in corporate profits.
Business Models Will Likely Continue to Prosper
The great rotation trade out of growth stocks into value is playing out in a significant way currently as investors sell out of high‑growth stocks in favor of cheaply valued companies, especially those most sensitive to economic recovery. However, at some point, we believe the value reflation trade will play out, and valuations, at some point, will catch up to long‑term averages. With easy returns harder to find, there is every possibility that the appeal of growth stocks, namely the potential to consistently grow free cash flows over time, will reimpose itself once more.
Indeed, despite the strong relative outperformance by value stocks in 2021, there is very little to suggest that the outlook has materially changed for growth‑oriented companies. Perhaps a more relevant question looking forward might be: Can U.S. large‑cap growth companies—which have delivered strong returns over the past 10 years—continue in a similar vein over the next 10? With so many variables, this is impossible to answer with certainty. However, the underlying business models of these companies have not suddenly become flawed. The qualities that we look for in potential compound growth companies, such as competitive advantage, pricing power, high margins, and dominant positions in large and durable markets, are still very much in evidence.
Company Profits Have Recovered Strongly Since Early 2020
(Fig. 2) Quarterly U.S. corporate profits
Past performance is not a reliable indicator of future performance.
As of January 31, 2021.
Quarterly U.S. corporate profits after tax, seasonally adjusted.
Source: Federal Reserve Bank of St. Louis. Data analysis by T. Rowe Price.
Alphabet and Facebook, are two of the most successful companies of the past decade. Principally, this is due to the fact that they are the dominant players in the field of digital advertising. Thanks to rising internet penetration rates and the ever‑expanding popularity of digital platforms around the world, digital advertising is fast becoming the most effective and preferred form of advertising. Spending on digital advertising has been growing rapidly and looks set to increase over coming years. And as the established, dominant players in this secular growth area, both companies could quite reasonably continue to grow at a faster pace than the market for years to come.
In a similar vein, e‑commerce giant Amazon has clearly demonstrated an ability to reinvent itself and find novel areas of growth and momentum. We believe Amazon’s logistics capabilities could be a driver of long‑term growth. In addition, its digital advertising business, while still very small compared with Alphabet and Facebook, offers a good potential growth opportunity, in our view.
"…the onset of the coronavirus pandemic has forced many growth companies to adapt their businesses, improve operationally, and provide better customer service."
It is worth highlighting that the onset of the coronavirus pandemic has forced many growth companies to adapt their businesses, improve operationally, and provide better customer service. In 2020, for example, we saw the widespread adoption of e‑commerce as people were forced to shop online. As a result, businesses like Amazon invested huge sums in streamlining operations and improving logistics in order to provide better experiences for customers. Groceries was previously an area of Amazon’s business that suffered from poor customer experience, and over the past 12 months, this has improved greatly. We expect to see more of this reallocation of investment toward e‑commerce, as well as digital advertising.
The Appeal of U.S. Growth Companies Is Fundamentally Unchanged
The principal appeal of growth companies is their demonstrated ability to grow their free cash flow over time. This is an essential feature as it represents the surplus or discretionary cash that a company generates. Over the past decade, the cumulative growth in free cash flows generated by U.S. growth companies has been massive. The key question now is, has this ability been materially impacted or diminished over the past 12 months? We firmly believe that it has not. We believe the inherent, fundamental ability of growth stocks to grow free cash flows over time remains very much intact.
-
The weight of the securities mentioned above in the Large-Cap Growth Fund were as follows: Alphabet 9.50%; Amazon 8.58%; Facebook 6.20%. As of June 30, 2021.
1 Past performance is not a reliable indicator of future results. Source S&P 500 (see Additional Disclosure).
2 Actual future outcomes may differ materially from estimates.
-
Additional Disclosure
The S&P 500 is a product of S&P Dow Jones Indices LLC, a division of S&P Global, or its affiliates (“SPDJI”) and has been licensed for use by T. Rowe Price. Standard & Poor’s® and S&P® are registered trademarks of Standard & Poor’s Financial Services LLC, a division of S&P Global (“S&P”); Dow Jones® is a registered trademark of Dow Jones Trademark Holdings LLC (“Dow Jones”). T. Rowe Price is not sponsored, endorsed, sold or promoted by SPDJI, Dow Jones, S&P, their respective affiliates, and none of such parties make any representation regarding the advisability of investing in such product(s) nor do they have any liability for any errors, omissions, or interruptions of the S&P 500.
Important Information
Call 1-800-225-5132 to request a prospectus or summary prospectus; each includes investment objectives, risks, fees, expenses, and other information you should read and consider carefully before investing.
This material is provided for informational purposes only and is not intended to be investment advice or a recommendation to take any particular investment action.
Growth stocks are subject to the volatility inherent in common stock investing, and their share price may fluctuate more than that of income‑oriented stocks. Investing in technology stocks entails specific risks, including the potential for wide variations in performance and usually wide price swings, up and down.
The views contained herein are those of the authors as of July 2021 and are subject to change without notice; these views may differ from those of other T. Rowe Price associates.
This information is not intended to reflect a current or past recommendation concerning investments, investment strategies, or account types, advice of any kind, or a solicitation of an offer to buy or sell any securities or investment services. The opinions and commentary provided do not take into account the investment objectives or financial situation of any particular investor or class of investor. Please consider your own circumstances before making an investment decision.
Information contained herein is based upon sources we consider to be reliable; we do not, however, guarantee its accuracy. Actual future outcomes may differ materially from any estimates and forward‑looking statements made.
Past performance is not a reliable indicator of future performance. All investments are subject to market risk, including the possible loss of principal. All charts and tables are shown for illustrative purposes only.
T. Rowe Price Investment Services, Inc.
© 2021 T. Rowe Price. All Rights Reserved. T. ROWE PRICE, INVEST WITH CONFIDENCE, and the Bighorn Sheep design are, collectively and/or apart, trademarks of T. Rowe Price Group, Inc.