


- On U.S. Equities And Fixed Income
- Fifteen Years of Seeking to Exploit Market Inefficiencies
- Investing against the grain has brought rewards for clients.
- 2021-08-04 19:37
- Key Insights
-
- David Giroux celebrated 15 years managing the fund, which generated equity-like returns with much less volatility than the S&P 500 Index over the period.
- Giroux seeks to take advantage of inefficiencies in the equity and fixed income markets, with an eye toward outperforming on a risk-adjusted basis.
- The market is constantly evolving, but Giroux sees plenty of opportunities for the team to try to exploit with its rigorous process.
The Capital Appreciation Fund1 delivered 98% of the S&P 500 Index’s annualized return over the 15 years ended June 30, 2021, while taking 69% of the risk (as measured by standard deviation).2 Over this same period, the fund’s cumulative total return ranked in the top 1% of the 218 funds in Lipper’s Mixed-Asset Target Allocation Growth classification, and its average annual total return landed in the top 1% of the 318 funds in Morningstar’s Allocation–50% to 70% Equity category for the time period (Figure 2).3 In addition, the fund’s equity and fixed income holdings both outperformed their respective benchmarks over the decade and a half that ended June 30, 2021 (Figure 3). In this Q&A, Giroux discusses his investment process and how the in-depth research into individual companies and industries that he and his team conduct gives them the conviction to lean against the crowd. In his view, equity and fixed income markets show some signs of becoming more inefficient over time, potentially broadening the opportunity set that he and his team seek to exploit.
"The Capital Appreciation Fund delivered 98% of the S&P 500 Index’s annualized return over the 15 years ended June 30, 2021, while taking 69% of the risk (as measured by standard deviation).2"
How do the fund’s three objectives inform your approach to investing through the cycle?
The fund seeks long-term capital appreciation by investing primarily in common stocks, and we look to achieve this objective in three ways:
1. Generate strong risk-adjusted returns annually;
2. Preserve shareholder capital over the intermediate term (i.e., three years); and
3. Generate equity-like returns with less risk than that of the overall market over a full market cycle (i.e., normally five years).
Standardized Performance
(Fig. 1) Total returns through periods ended June 30, 2021
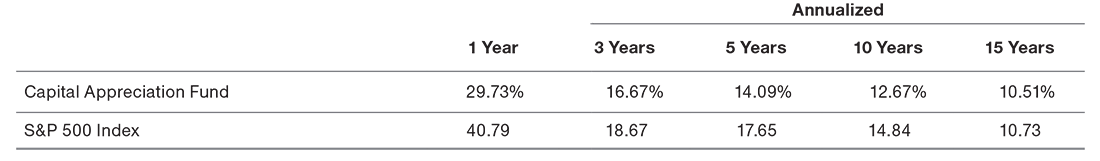
Sources: Standard & Poor’s (see additional disclosures) and T. Rowe Price.
Performance data quoted represents past performance and does not guarantee future results. Investment return and principal value will fluctuate so that an investor’s shares, when redeemed, may be worth more or less than their original cost. Current performance may be lower or higher than the performance data quoted. To obtain the most recent month-end performance, visit troweprice.com. The fund’s gross expense ratio was 0.70% as of its most recent prospectus. The fund may have other share classes available that offer different investment minimums and fees. See the prospectus for details. Total return figures include changes in principal value, reinvested dividends, and capital gain distributions.
A big part of our approach is identifying the parts of the market that are likely to contain the greatest number of “fish” that we want to catch: the names that we believe offer the highest odds of generating strong risk-adjusted returns over time. Some of our favorite “fishing ponds” are low-volatility stocks that we believe offer the prospect of steady earnings growth at a reasonable price (GARP) as well as BB-rated bonds and leveraged loans.
"A big part of our approach is identifying the parts of the market that are likely to contain the greatest number of “fish” that we want to catch...."
How we allocate to equities, fixed income, and cash through the cycle is another area of focus. We strive to reduce risk at the top of the market cycle. With an eye toward capturing as much upside as possible, we try to go all-in on risk assets at the bottom of a cycle. For example, at the height of the market panic stemming from the coronavirus pandemic, we deployed about USD 5.7 billion into equities in less than one month and about USD 543 million into bank loans and high yield bonds.4
How do you balance bottom-up stock selection with broader, top-down considerations?
One of our competitive advantages is our in-depth understanding of the companies in which we invest. Deep knowledge of individual companies and industry dynamics gives us the conviction to be contrarian because we understand the factors behind why a stock may be down and whether the cause of that weakness is likely to be temporary or more durable. The vast majority of our stock purchases during the course of a year are made when a particular stock is down or underperforming. The same holds true for newly initiated positions. We almost always add new names to the portfolio following a period of relative weakness. Buying securities of high-quality companies when temporary factors have caused them to fall out of favor is at the heart of our strategy.
We often lean against the conventional wisdom. For example, when people want to own cyclical businesses that exhibit greater sensitivity to economic conditions, we’re usually buying names in defensive industries. When people want to own defensive stocks, we’re usually buying cyclicals. We typically invest where we see value and lean against the crowd and consensus expectations for the market and economy. We have found that the consensus often has been wrong, especially on a one- or a two-year basis.
Strong Historical Returns Relative to Peers
(Fig. 2) Capital Appreciation Fund’s Lipper rankings (based on cumulative total returns) and Morningstar rankings (based on average annual total returns)
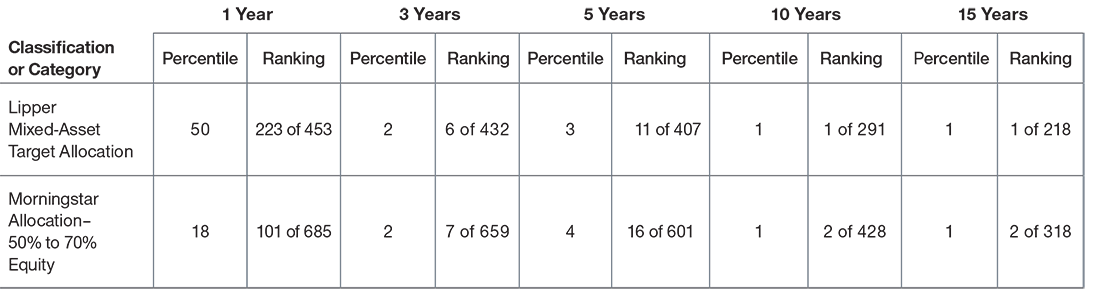
As of June 30, 2021.
Performance data quoted represents past performance and is not a reliable indicator of future performance. Investment return and principal value will fluctuate so that an investor’s shares, when redeemed, may be worth more or less than their original cost. Current performance may be lower or higher than the performance data quoted. To obtain the most recent month-end performance, visit troweprice.com.
Lipper rankings are based on cumulative total returns. Morningstar rankings are based on average annual total returns. For the Percentile column, a lower percentile equates to a higher ranking versus other funds in the same classification or category (e.g., a percentile ranking of 25 means that the fund’s total return for that period is greater than 75% of all funds within the respective category over a given period.) The Ranking column shows the total number of funds in the classification or category and the numerical ranking of the Capital Appreciation Fund.
Source for Lipper Index Data: Lipper, Inc. Portions of the mutual fund information contained in this table was supplied by Lipper, a Refinitiv Company, subject to the following: Copyright 2021 © Refinitiv. All rights reserved. Any copying, republication or redistribution of Lipper content is expressly prohibited without the prior written consent of Lipper. Lipper shall not be liable for any errors or delays in the content, or for any actions taken in reliance thereon.
Source for Morningstar data: © 2021 Morningstar, Inc. All Rights Reserved. The information contained herein: (1) is proprietary to Morningstar and/or its content providers; (2) may not be copied or distributed; and (3) is not warranted to be accurate, complete or timely. Neither Morningstar nor its content providers are responsible for any damages or losses arising from any use of this information. Past performance is no guarantee of future results.
From an asset class perspective, tell us about your approach to fixed income investing. Over the 15 years ended June 30, 2021, the fund’s fixed income holdings posted (gross of fees) an average annual excess return of 216 basis points (bps)5 relative to the Bloomberg Barclays U.S. Aggregate Bond Index.
With fixed income securities, we’re looking for the highest yields we can find without running the risk of a permanent loss of capital because of a default. If you look at my 15-year career, we have never lost money on a bond or leveraged loan due to a default. Our approach has sometimes resulted in less liquidity, but if we see the potential to add 200 to 300 bps of yield and not suffer a default, as we have historically, that’s a situation we would want to exploit.
On an annualized basis, the fund’s equity holdings delivered (gross of fees) an excess return of 474 bps5 relative to the S&P 500 Index over the 15 years ended June 30, 2021. What are the key features of your equity investing process?
We do not spend any time on the roughly 25% of companies in the S&P 500 Index that we believe are facing secular risk. Companies where we view management’s capital deployment as subpar also fall by the wayside, as does what I call the far-right side of the growth style box—the names that we believe would need to sustain an incredible growth rate for a long time to justify their extraordinarily high valuations. In addition, there is a good chunk of the S&P 500 that we tend to avoid because we do not believe that these individual companies have the potential to accrete earnings or cash flow per share plus dividends in the 9% to 12% range.
Relative Performance at the Asset Class Level
(Fig. 3) Excess returns1 through periods ended June 30, 2021
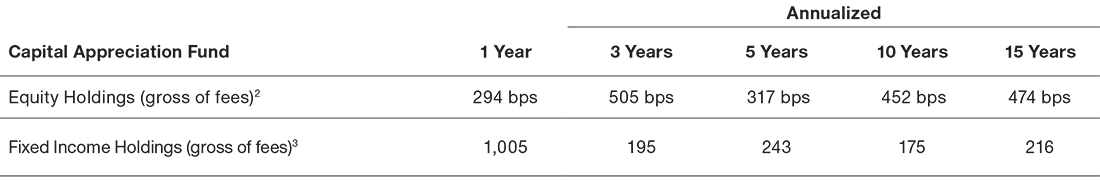
Sources: Standard & Poor’s Financial Services LLC and Bloomberg Index Services Limited (see Additional Disclosures.) All data analysis by T. Rowe Price.
Important Disclosure:
Past performance is not a reliable indicator of future performance. Gross of fees excess returns are presented before expenses and all other fees, where applicable. Returns would be lower as a result of the deduction of such fees. A basis point is 0.01 percentage point.
1 Excess returns are the difference between the total returns (gross of fees and reflecting the reinvestment of dividends and capital gains, if any) for the Capital Appreciation Fund’s equity and fixed Income holdings and the total returns (including the reinvestment of gross dividends) posted by their corresponding benchmarks: the S&P 500 Index for the fund’s equity securities and the Bloomberg Barclays U.S. Aggregate Bond Index for the fund’s fixed income securities. These excess returns do not show the extent to which the size of the fund’s allocation to equities or fixed income securities as an asset class contributed to the fund’s overall performance. As of June 30, 2021, equity securities accounted for 57.3% of the fund’s total net assets; calls written against equity securities accounted for 13.5%; fixed income holdings (bonds and leveraged loans) accounted for 18.5%; cash reserves net accounted for 9.7%; and convertible securities accounted for 1.7%. These percentage weightings may not total 100% due to rounding.
2 Analysis represents the underlying equity component of the overall portfolio as calculated by T. Rowe Price. These excess returns show the performance of the fund’s equity holdings relative to the benchmark for the individual equity portion of the fund, the S&P 500 Index. This metric is intended to isolate the overall excess returns/loss derived from selecting securities differently from the benchmark within the equity portion of the fund. The fund’s positions in equity options are reflected in the calculation.
3 Analysis represents the underlying fixed income component of the overall portfolio as calculated by T. Rowe Price. These excess returns show the performance of the fund’s fixed income holdings relative to the benchmark for the fixed income portion of the fund, the Bloomberg Barclays U.S. Aggregate Bond Index. This metric is intended to isolate the overall excess returns/loss derived from selecting securities differently from the benchmark within the fixed income portion of the fund.
Omitting these areas of the market leaves us with about 100 quality names that we regard as the core of our investment universe and roughly another 100 solid companies with cyclical business models that we typically would only own in a downturn.
"The team concentrates its equity research efforts on what I call the CAF 100—names that we believe have the highest odds of generating strong risk-adjusted returns over time."
The team concentrates its equity research efforts on what I call the CAF 100—names that we believe have the highest odds of generating strong risk-adjusted returns over time. The fund typically holds the 40 to 60 stocks that strike us as offering the best risk/reward proposition at any given time.
What qualities characterize the names in the CAF 100?
A lot of these companies fall in the GARP universe, which, based on our definition, is roughly 13% to 14% of the S&P 500 Index and is our favorite “fishing pond.”
Our favorite names in this universe operate what we believe are high-quality business models that, over the course of a full economic cycle, have typically grown their earnings per share by more than the market and tend to convert operating cash flow to free cash flow at higher rates. The GARP stocks toward which we tend to gravitate historically have been somewhat more resilient during downturns—historically experiencing downside somewhere between 50% and 80% of the drawdown, or loss, in the broader market.
The kind of GARP stocks we seek typically offer, in our view, the potential for a rate of earnings per share growth and dividends that add up to between 9% and 12% annually. We have found that in instances where these types of companies get better with age and their organic growth rates improve, the valuation multiples attached to their stocks have the potential to expand, possibly driving additional upside.
Equity Market-Like Returns1 with Less Historical Volatility2
(Fig. 4) Capital Appreciation Fund vs S&P 500 Index
As of June 30, 2021.
Standard & Poor’s (see additional disclosures) and T. Rowe Price. All data analysis by T. Rowe Price.
Fund performance figures are net of fees.
Performance data quoted represents past performance and does not guarantee future results. Investment return and principal value will fluctuate so that an investor’s shares, when redeemed, may be worth more or less than their original cost. Current performance may be lower or higher than the performance data quoted. To obtain the most recent month-end performance, visit troweprice.com.
The fund’s gross expense ratio was 0.70% as of its most recent prospectus.
1 The fund’s total return figures reflect the reinvestment of dividends and capital gains, if any. Index returns include gross dividends reinvested.
2 Here, historical volatility is measured by standard deviation. Volatility is only one aspect of risk. Standard deviation and volatility do not reflect all the types of risk involved in the strategy.
3 This metric divides the Capital Appreciation Fund’s annualized total return by the S&P 500 Index’s annualized return over the same time frame. Percentages greater than 100% indicate that the fund outperformed relative the S&P 500 Index; readings close to 100% indicate similar performance; and readings below 100% indicate underperformance.
4 This metric divides the Capital Appreciation Fund’s annualized standard deviation by the S&P 500 Index’s annualized standard deviation over the same time frame. Percentages below 100% indicate that the fund exhibited less volatility than the S&P 500 Index; readings close to 100% indicate similar levels of historical volatility; and readings above 100% indicate that the fund experienced higher levels of relative volatility.
Structural and behavioral factors can also create pricing inefficiencies for us to try to exploit in this universe.
GARP stocks often find themselves in an excluded middle that falls outside the range of the huge pools of capital that figure prominently in the marketplace. These companies typically don’t appeal to growth managers, many of whom want names that are increasing their revenues organically by at least 10% annually; for value-focused managers, these stocks trade at price-to-earnings ratios that might be outside their comfort zone. Hedge funds tend to favor high-volatility names.
With all of these large pools of capital biased against owning GARP companies, we’ve historically found opportunities to take advantage of what we regard as irrationally low prices for high-quality business models that should be able to compound in value over time.
All told, we’ve identified 16 market inefficiencies, the majority of which are structural or behavioral. We keep these inefficiencies close to the vest. I will say that with the rise of passive investment strategies and more investors with a shorter time horizon, we believe that the market could become more inefficient over time, potentially creating more opportunities for us to exploit. In our view, that may be one of the reasons why over the last three years, our equity holdings have posted an annualized excess return of 505 bps relative to the S&P 500 Index—or slightly more than the 15-year average.6 We believe the market is getting more inefficient, not less.
What are some of the bigger-picture concerns you have?
The market is an echo chamber, with so many voices suggesting that whatever is going on today will continue indefinitely into the future. It reminds me of the sirens’ call in Homer’s Odyssey—if you listen too much to the market, your ship might end up on the rocks. But leaning against the consensus takes a significant toll on me. Imagine that you walk into the office and 80% to 90% of the time, the market, the media, the strategists, and the pundits are telling you that you are wrong. It is not easy to ignore or not let it affect you. For me, it is probably the biggest cause of lost sleep. But it is by far one of the greatest market inefficiencies to try to exploit, in my view, as many portfolio managers and market participants allow themselves to be stirred into the rocks by the sirens’ call.
"Right now, I worry a bit that the market may be in for something of a rude awakening."
Right now, I worry a bit that the market may be in for something of a rude awakening. The market’s valuation appears to have priced in the view that earnings per share, which in 2021 appear higher than if we had never experienced a pandemic, will continue to grow at a strong pace in the coming years. Given the amount of fiscal stimulus and direct payments to households, I’m concerned that the market is overlooking the likelihood that some of this bump in consumer spending is one-time in nature. What will happen when households’ disposable incomes normalize? What will happen as commodity prices revert to more normalized levels? Banks’ earnings are likely to be elevated in 2021 due to large one-time reserve releases that we should not expect to repeat in the coming years. If a slowdown in earnings growth does materialize, the valuation multiple for the broader equity market could contract.
Do you have concerns about signs of excessive speculation in the marketplace and the prospect of the Federal Reserve scaling back its accommodative policies?
We’ve all seen the huge moves in cryptocurrencies. Certain low-quality “meme” stocks have also been bid up to levels that can’t possibly be justified by underlying business fundamentals. It’s pure speculation, with the buyer hoping that the next person will buy the stock at an even higher price. Even so, I don’t think these pockets of speculative excess pose a systemic risk to the broader equity market.
As for the Fed reducing its monthly bond purchases and raising rates, these actions could put some pressure on the price-to-earnings multiple at which the broader market trades, in part, because once the central bank starts to tighten monetary policy, it signals that the recovery cycle is no longer in its early stages. That said, I think the market puts far too much weight on the Fed’s actions. When the Fed funds rate was at its recent peak of about 2.5%, loan growth didn’t dry up—at those levels, rates were still relatively low. A Fed funds rate between 1% and 2% should not materially affect economic fundamentals, in my view, although it could have a marginal impact on the mortgage and auto lending markets.
What would you tell your fellow Capital Appreciation Fund shareholders about the next five years?
First, I would say that the creation of T. Rowe Price Investment Management7 should make it easier for the fund to own more of the companies that we want to own and, in some instances, in greater size. But even with this change, our clients should broadly expect more of the same. We remain committed to continuous improvement as we pursue our three performance goals. Since I took over the fund, the team has gone from me and one research associate to five people focused on fundamental analysis, allowing us to develop an even deeper understanding of the companies in which we invest. We’ve also built a rigorous investment process and benefited from the support of a strong quantitative team that helps us to identify possible market inefficiencies to exploit and the stocks that look most attractive within our framework. This team is always honing its analytics and developing new tools. The Capital Appreciation Fund is so much more than just me. We believe it is our repeatable, differentiated process and focus on generating strong risk-adjusted returns that have driven our strong results. The team and I look forward to continuing to do what we believe is best for you, our clients.
-
Fund Risks: The value approach carries a risk that the market will not recognize a security’s intrinsic value for a long time or that a stock judged to be undervalued may actually be appropriately priced. Dividends are not guaranteed. Because of the fund’s fixed-income holdings cash position, it may not keep pace in a rapidly rising market. Fixed-income securities are subject to credit risk, liquidity risk, call risk, and interest-rate risk. As interest rates rise, bond prices generally fall. Investments in high-yield bonds involve greater risk of price volatility, illiquidity, and default than higher-rated debt securities. Investments in bank loans may at times become difficult to value and highly illiquid; they are subject to credit risk such as nonpayment of principal or interest, and risks of bankruptcy and insolvency. The use of options subjects the fund to additional volatility and potential losses.
1 The fund is closed to new investors.
2 Past performance is not a reliable indicator of future performance. Standard deviation is a measure of the amount of variation or dispersion in a set of values. A low standard deviation indicates that the values tend to be close to the mean of the set, while a high standard deviation indicates that the values are spread out over a wider range. Standard deviation measures volatility, which is only one aspect of risk. Standard deviation and volatility do not reflect all the types of risk involved in the strategy. See Figure 4 for historical risk and return data relative to the S&P 500 Index.
3 Past performance is not a reliable indicator of future performance. Please see Figure 2 for additional important details regarding the rankings.
4 Period referenced covers February 25, 2020, to March 23, 2020. Values of securities purchased by the fund are net of sales.
5 A basis point is 0.01 percentage point.
Past performance is not a reliable indicator of future performance. The excess returns are intended to isolate the overall excess returns/loss derived from selecting securities differently from the benchmark within each of the fixed income and equity portions of the fund. See additional important disclosure in Figure 3.6 Past performance is not a reliable indicator of future performance. The excess return is intended to isolate the overall excess returns/loss derived from selecting securities differently from the benchmark within the equity portion of the fund. The excess return does not show the extent to which the size of the fund’s allocation to equities contributed to overall performance. See additional important disclosure in Figure 3.
7 Important Information: T. Rowe Price Associates, Inc. (TRPA) announced on November 19, 2020, its intent to create a new separate SEC-registered U.S. investment adviser, T. Rowe Price Investment Management (TRPIM). Pending all approvals, TRPA will transition the adviser of this strategy from TRPA to TRPIM in the second quarter of 2022. For more information on T. Rowe Price Investment Management, read the press release https://www.troweprice.com/content/dam/trowecorp/Press_Release_USEQI2020.pdf.
-
Additional Disclosures
Standard & Poor’s® and S&P® are registered trademarks of Standard & Poor’s Financial Services LLC, a division of S&P Global (“S&P”); Dow Jones® is a registered trademark of Dow Jones Trademark Holdings LLC (“Dow Jones”). This product is not sponsored, endorsed, sold, or promoted by SPDJI, Dow Jones, S&P, their respective affiliates, and none of such parties make any representation regarding the advisability of investing in such product(s) nor do they have any liability for any errors, omissions, or interruptions of the S&P Index.
Bloomberg Index Services Limited. BLOOMBERG® is a trademark and service mark of Bloomberg Finance L.P. and its affiliates (collectively “Bloomberg”). BARCLAYS® is a trademark and service mark of Barclays Bank Plc (collectively with its affiliates, “Barclays”), used under license. Bloomberg or Bloomberg’s licensors, including Barclays, own all proprietary rights in the Bloomberg Barclays Indices. Neither Bloomberg nor Barclays approves or endorses this material, or guarantees the accuracy or completeness of any information herein, or makes any warranty, express or implied, as to the results to be obtained therefrom and, to the maximum extent allowed by law, neither shall have any liability or responsibility for injury or damages arising in connection therewith.
Important Information
Call 1-800-225-5132 to request a prospectus or summary prospectus; each includes investment objectives, risks, fees, expenses, and other information you should read and consider carefully before investing.
This material is provided for informational purposes only and is not intended to be investment advice or a recommendation to take any particular investment action.
The views contained herein are those of the authors as of July 2021 and are subject to change without notice; these views may differ from those of other T. Rowe Price associates.
The fund is subject to market risk, as well as risks associated with unfavorable currency exchange rates and political economic uncertainty abroad.
This information is not intended to reflect a current or past recommendation concerning investments, investment strategies, or account types, advice of any kind, or a solicitation of an offer to buy or sell any securities or investment services. The opinions and commentary provided do not take into account the investment objectives or financial situation of any particular investor or class of investor. Please consider your own circumstances before making an investment decision.
Information contained herein is based upon sources we consider to be reliable; we do not, however, guarantee its accuracy. Actual future outcomes may differ materially from any estimates or forward looking statements made.
Past performance is not a reliable indicator of future performance. All investments are subject to market risk, including the possible loss of principal. All charts and tables are shown for illustrative purposes only.
T. Rowe Price Investment Services, Inc.
© 2021 T. Rowe Price. All Rights Reserved. T. ROWE PRICE, INVEST WITH CONFIDENCE, and the Bighorn Sheep design are, collectively and/or apart, trademarks of T. Rowe Price Group, Inc.