
INVESTMENT INSIGHTS
Do Yield Curve Inversions Still Predict Recessions in the Age of QE?
November 2019
Tomasz Wieladek
, T.Rowe Price Chief European Economist
Key insights
- Conventional wisdom suggests that U.S. recessions usually follow an inverted yield curve. However, we should be wary of assuming this applies today.
- Our analysis suggests that when government debt on a central bank’s balance sheet exceeds 10%, an inverted yield curve loses its predictive power.
- As such, we believe investors should put greater weight on macroeconomic fundamentals when assessing the risk of recession in the current environment.
Conventional wisdom suggests that U.S. recessions usually follow an inverted yield curve. This is not surprising: Since 1960, seven U.S. recessions have been preceded by an inverted yield curve. Given that the U.S. yield curve has once again inverted, should we therefore assume that a recession is on its way?
I advise caution. The latest U.S. yield curve inversion has occurred after a decade of large‑scale government bond purchases (quantitative easing (QE)) by the Federal Reserve (Fed), the Bank of England, the Bank of Japan, and the European Central Bank. Both historical precedent and our own internal modeling suggest that the presence of these central banks in their respective bond markets as a buyer of last resort allows for the possibility that term premia (the risk premia that investors require to hold a long‑term bond to maturity) are much smaller and less reactive to macroeconomic news. It is therefore plausible that yield curve inversions in the age of QE may not have the same predictive qualities as in the past.
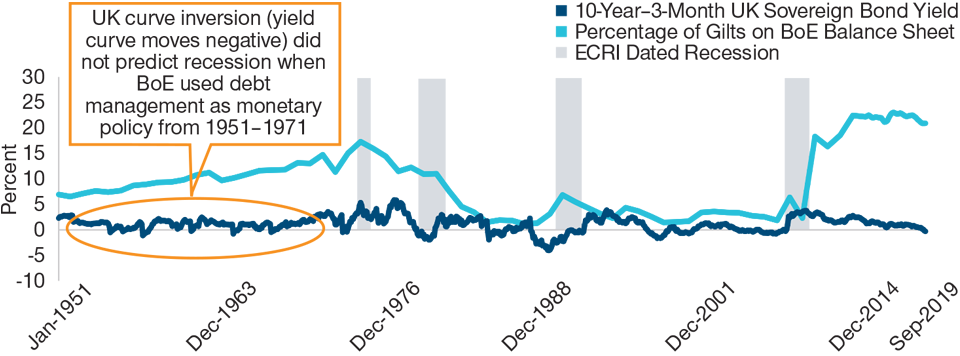
(Fig. 1) UK Yield Curve Inversions in the Era of Sovereign Debt Management
Six inversions between 1951 and 1971 did not predict recessions
As of September 2019
Past performance is not a reliable indicator of future performance.
Sources: Bank of England (BoE) and Economic Cycle Research Institute (ECRI).
The main task of modern monetary policy is to keep the economy on a “Goldilocks” growth path: not too hot to create inflation and financial imbalances, but not too cold to keep GDP growth below potential.
Yield Curve Inversions in the Bretton Woods Era
The main task of modern monetary policy is to keep the economy on a “Goldilocks” growth path: not too hot to create inflation and financial imbalances, but not too cold to keep GDP growth below potential. The main instrument used to achieve this has traditionally been the short‑term interest rate. When short‑term interest rate adjustments are not available as a policy tool, central banks have often turned to sovereign debt purchases instead, the most obvious recent example of which is the QE that took place since the global financial crisis.
There is historical precedent for this type of large‑scale central bank intervention in the bond market. In the 1950s and 1960s, the Bank of England relied on sovereign debt management for monetary policy. It mostly used the short‑term rate to keep sterling within the Bretton Woods system of fixed exchange rates, while sovereign debt management policy was used to balance aggregate demand and supply. At the time, UK banks were subject to a 30% minimum liquid asset ratio, and unlike short‑term Treasury bills, longer‑term gilts did not count toward this liquidity ratio. Selling gilts to banks and absorbing Treasury bills therefore allowed the Bank of England to tighten the liquidity ratio constraint and hence reduce credit supply. During this policy regime, which lasted from 1951 to 1971, the yield curve inverted seven times, driven by rises in short‑term rates, but no recessions followed (see Fig. 1). It was only after this policy was abandoned that UK yield curve inversions began to predict UK recessions.
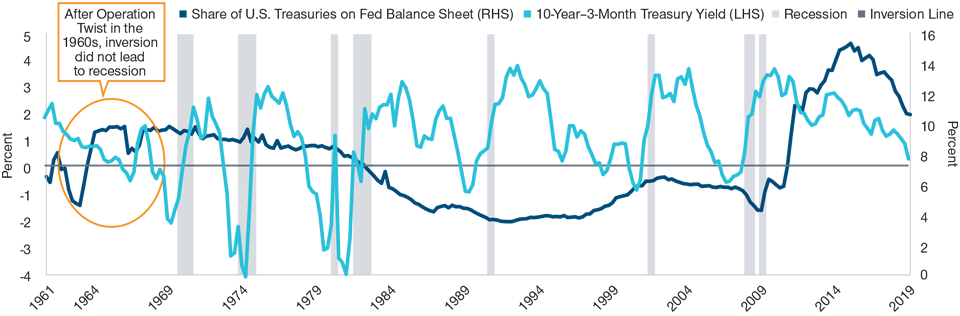
(Fig. 2) The One Exception to an Almost Certain Rule in the U.S.
The last time the Fed bought Treasuries on a large scale, a yield curve inversion failed to predict a recession
As of September 20, 2019
Past performance is not a reliable indicator of future performance.
Sources: Federal Reserve and National Bureau of Economic Research.
The U.S. Federal Reserve similarly relied on purchases of sovereign debt to stimulate the U.S. economy in the 1960s (see Fig. 2). As in the UK, the fed funds rate in the U.S. was also constrained by the Bretton Woods system of fixed exchange rates. In the early 1960s, the economy was slowing, but the short‑term rate could not be lowered. To stimulate demand, the Fed implemented “Operation Twist”—selling short‑term Treasury bills in exchange for longer‑term Treasury notes. Within one year, the Fed purchased roughly 5% of the Treasury bond market, roughly equivalent to QE1 during the global financial crisis, pushing the Fed’s total holdings to slightly under 10% of the bond market. The yield curve inversion that followed the end of Operation Twist in 1966 coincided with a tightening of monetary policy via bank credit, but not to a level where policy was restrictive. The slow reaction of the long‑term rate then led to an inversion of the yield curve for about one year, but this was the one time in postwar U.S. history that no recession followed.
There are several reasons why the lessons of the 1960s in the UK and U.S. may not apply today. For instance, these historical examples occurred during the Bretton Woods system, at a time of strong policy coordination to maintain a fixed exchange rate against the U.S. dollar. By contrast, the current monetary policy regime is characterized by flexible exchange rates and a lack of explicit policy coordination across countries. The other important difference is that many central banks have gained at least operational independence to implement monetary policy since the Bretton Woods system ended. Whether or not these historical lessons continue to apply in the current monetary policy regime is therefore ultimately an empirical question.
Bloated Central Bank Balance Sheets May Scramble the Inverted Yield Curve Signal
To test how effectively inverted yield curves have predicted recessions in the post-Bretton Woods era, we recently examined yield curve inversions associated with varying levels of sovereign debt held by G7 central banks since the early 1970s. Simple correlation analysis, shown in Fig. 3, shows that when the central bank owns close to 0% of sovereign debt, the correlation between the yield curve and recession four quarters ahead is -0.5. On the other hand, when the central bank owns close to 10% of government debt, the correlation between the yield curve and recession four quarters ahead is close to zero.
These simple correlation results, showing that an inverted yield curve loses predictive power for recessions when the central bank owns around 10% of government debt, also emerge when we apply more sophisticated econometric techniques.
(Fig. 3) The Crucial Impact of Government Debt
Yield curves negatively correlated with recessions when the share of sovereign bonds on central bank balance sheets is low.
As of September 2019
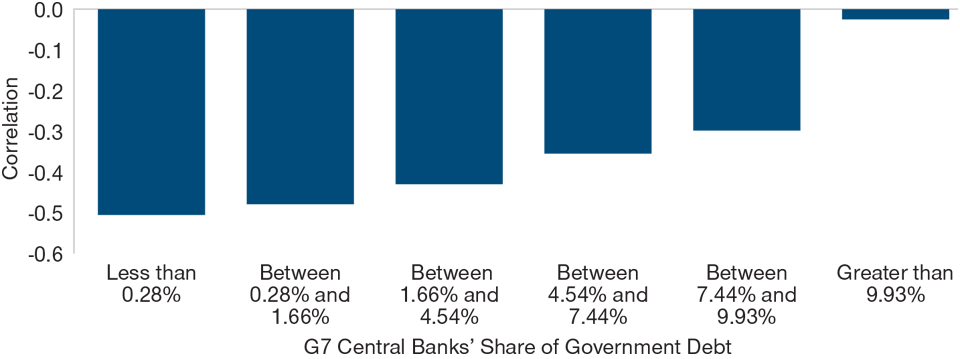
Source: T. Rowe Price.
When the share of government debt on the central bank’s balance sheet exceeds 10%, an inverted yield curve loses its predictive power for recessions.
Making Sense of Mixed Signals
Yield curves are negatively correlated with recessions only when the share of government debt on central bank balance sheets is low.
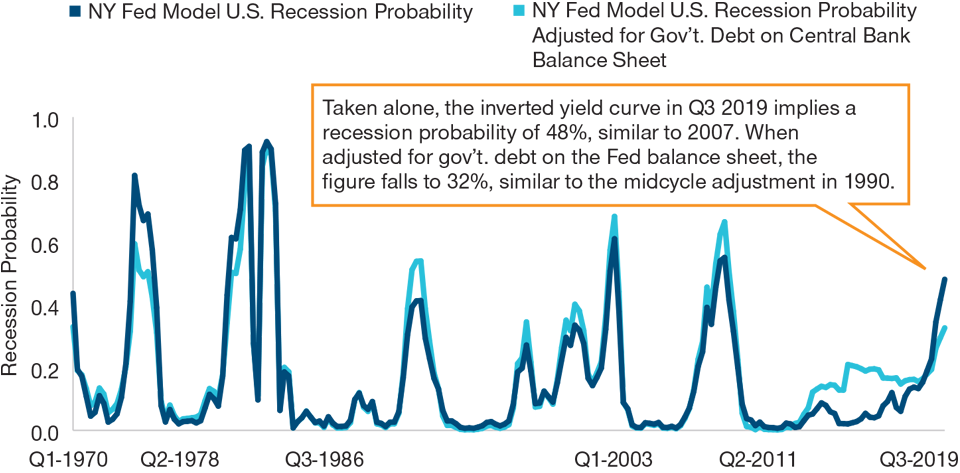
Figure 4 shows how these insights affect the conclusions of the NY Fed’s model of recession probability model, which provides the probability of recession 12 month ahead based only on the spread between the 3-month U.S. treasury bill and the 10-year U.S. treasury bond. Given that this spread inverted in Q3 2019, the NY Fed approach (dark blue line) implies a probability of recession of 48%, which is similar to the probability of recession this approach implied in 2007, right ahead of the global financial crisis. However, when this is adjusted for the presence of government debt on the Fed’s balance sheet, the model implies a reduced probability of 32%, similar to the signal sent in the late 1990s when the Federal Reserve cut interest rates to extend the expansion mid-cycle. This conclusion is also in line with recent rhetoric by Federal Reserve Chairman Jerome Powell about the situation today.
(Fig. 4) Recession Probability Implied From Our Research.
How predictive is the current yield curve inversion?
As of September 2019
Actual results may vary, perhaps significantly.
Sources: T. Rowe Price, International Monetary Fund, and New York Federal Reserve.
Overall, historical experience combined with our empirical analysis of more recent data in the G‑7 imply that yield curve inversions do not have the same predictive power for recession when central banks hold double‑digit shares of government debt.
Importantly, this does not mean that the probability of recession is lower, but rather that an inverted yield curve does not have the same predictive power as before.
What does this mean in practice? Rather than only relying on yield curve inversion, investors should put greater weight on macroeconomic fundamentals to assess recession risk. These continue to suggest that the risks of a U.S. recession within the next year are low.
What we’re watching next
The main lesson from this analysis is that in the age of QE, the yield curve is likely a less reliable predictor of recessions than in the previous five decades. The new dataset collected here will also allow us to examine which variables continue to predict recessions in the age of QE. This is where our analysis will likely go next.
IMPORTANT INFORMATION
This material is being furnished for general informational and/or marketing purposes only. The material does not constitute or undertake to give advice of any nature, including fiduciary investment advice, nor is it intended to serve as the primary basis for an investment decision. Prospective investors are recommended to seek independent legal, financial and tax advice before making any investment decision. T. Rowe Price group of companies including T. Rowe Price Associates, Inc. and/or its affiliates receive revenue from T. Rowe Price investment products and services. Past performance is not a reliable indicator of future performance. The value of an investment and any income from it can go down as well as up. Investors may get back less than the amount invested.
The material does not constitute a distribution, an offer, an invitation, a personal or general recommendation or solicitation to sell or buy any securities in any jurisdiction or to conduct any particular investment activity. The material has not been reviewed by any regulatory authority in any jurisdiction.
Information and opinions presented have been obtained or derived from sources believed to be reliable and current; however, we cannot guarantee the sources' accuracy or completeness. There is no guarantee that any forecasts made will come to pass. The views contained herein are as of the date noted on the material and are subject to change without notice; these views may differ from those of other T. Rowe Price group companies and/or associates. Under no circumstances should the material, in whole or in part, be copied or redistributed without consent from T. Rowe Price.
The material is not intended for use by persons in jurisdictions which prohibit or restrict the distribution of the material and in certain countries the material is provided upon specific request.
It is not intended for distribution retail investors in any jurisdiction.
201910‑967988
INVESTMENT INSIGHTS

INVESTMENT INSIGHTS
PRICE POINT - IN BRIEF