 SUMMER 2026
5 Big Investor Questions and Key Takeaways

Summary
At OHA’s Annual Meeting in May, Founder & CEO Glenn August delivered a presentation in which he addressed key questions for investors regarding 1) “cockroach” concerns, 2) AI disruption, 3) the Iran War, 4) private credit health, and 5) the opportunity set.
This report shares current OHA perspectives across these themes. Key takeaways include:
- Credit issues today are largely idiosyncratic rather than systemic
- AI disruption, geopolitical tensions, and the interest rate outlook present material market uncertainty
- Negative investor sentiment toward private credit is not supported by underlying fundamentals and market structure
- Dispersion and idiosyncratic challenges across borrowers are expanding the opportunity set
- A downside protection focus remains critical to navigating the current dynamic market environment
1. Where are the “Cockroaches”?
There are always “Cockroaches”
Markets entered 2026 with renewed volatility as investors continued to focus on where credit risk may be emerging. Recent high-profile frauds and bankruptcies have intensified scrutiny particularly of private credit, raising concerns about underwriting, documentation practices, risk oversight, and transparency in non-bank lending. The growing “cockroaches” narrative is that these examples signal broader weakness.
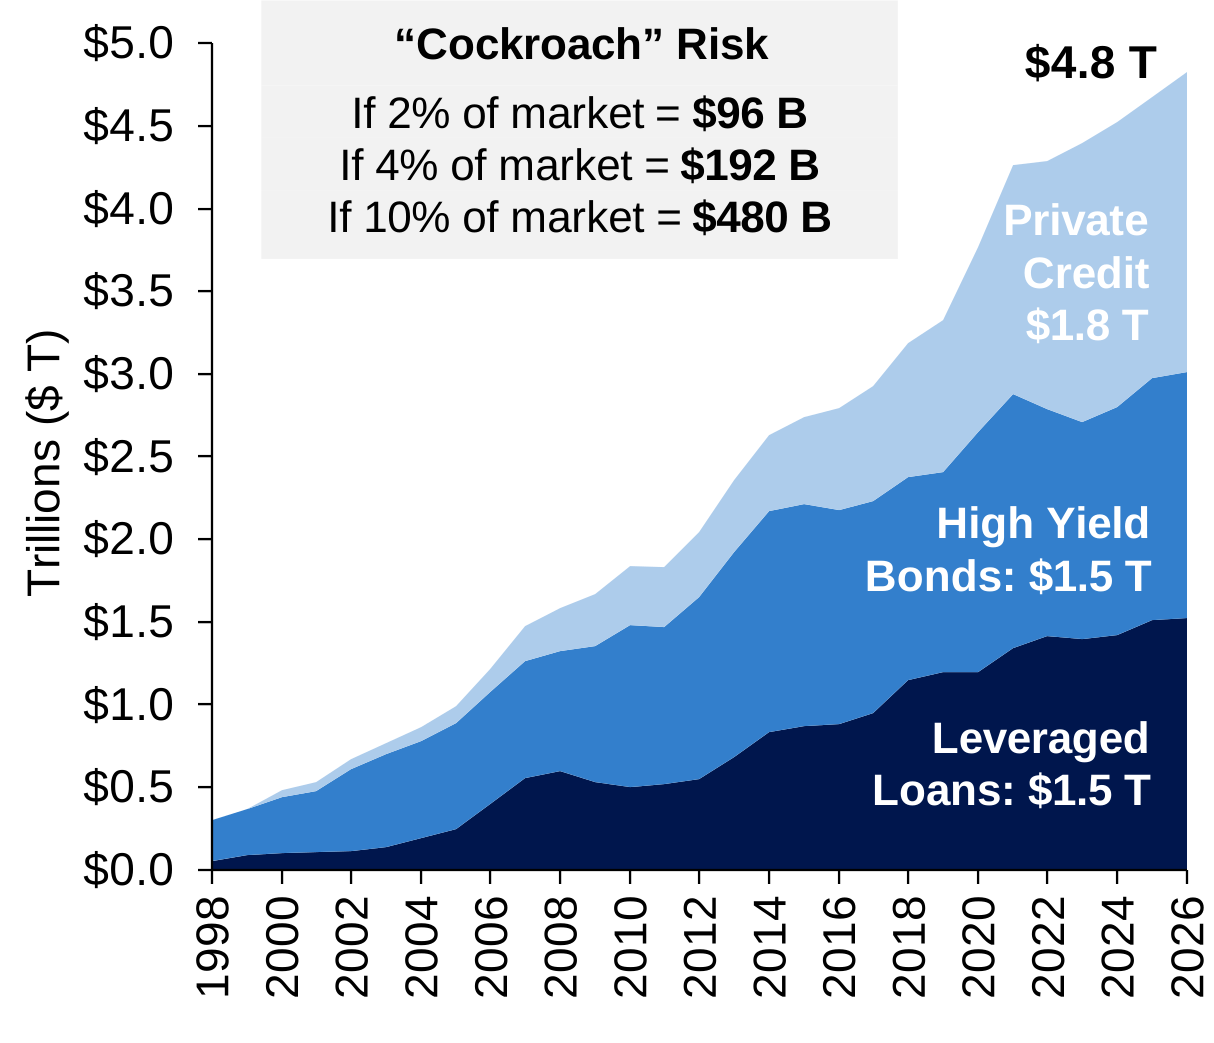
However, OHA believes these credit issues are largely idiosyncratic rather than indicative of systemic deterioration. History shows there are always “cockroaches” – weaker companies, management teams, industries, or documentation, and historical default rates reflect this reality. Over the long term, default rates averaged 3%-4%, ranging from roughly 2% to over 10% during periods of severe stress.2 Given the nearly $5 trillion size of the leveraged finance market, these default rates imply a meaningful level of challenged credits at any point in time, as illustrated in Figure 1.
Notably, current default rates overall remain benign at 2.9% for U.S. Loans and 1.9% for U.S. HY, suggesting credit weakness is generally not elevated relative to historical levels.3 Importantly, defaults have also typically been concentrated in specific sectors rather than broad-based. Skilled investors can identify and avoid challenged credits or selectively capitalize on these situations. More broadly, the persistence of credit issues reinforces the importance of disciplined underwriting, rigorous credit selection, and strong structural protections.
Fig. 1: Sizing U.S. Leveraged Finance Markets and “Cockroach” Risk1
2. How Will AI Impact Credit?
Discipline Through Disruption
The AI disruption shock, catalyzed by rapid advancements and model releases during Q1 2026, was a meaningful stress test for software credit. As seen in Figure 2, weighted average leveraged loan prices for technology issuers declined from $95.68 in October 2025 to $88.00 by May 2026. Following the initial largely indiscriminate selloff, weakness has remained concentrated in junior capital and less differentiated issuers, while senior secured credit has been comparatively resilient. While some companies will restructure, investment outcomes should vary significantly based on entry points and position in the capital structure, reinforcing the importance of disciplined underwriting and security selection.
OHA’s experience across market cycles underscores this approach. Since 2004, OHA has deployed nearly $40 billion in software credit with an annualized loss rate of 0.01%.6 OHA has consistently focused on businesses with vertical, mission-critical solutions, durable recurring revenue, proprietary data, and contracted enterprise customer bases while avoiding consumer-facing models, undifferentiated vendors, and ARR-based financings. OHA believes these characteristics position its software thesis and investments defensively for continued AI evolution.
AI is also driving a significant financing opportunity. An estimated $7 trillion in AI capex spending is anticipated by 2030, supported by more than 3x growth in data center capacity demand, with downstream implications for digital infrastructure, power, and energy infrastructure sectors.7 OHA seeks to increase deployment selectively across these areas for relevant mandates while maintaining its disciplined and thesis-driven approach.
Fig. 2: Software Loans4
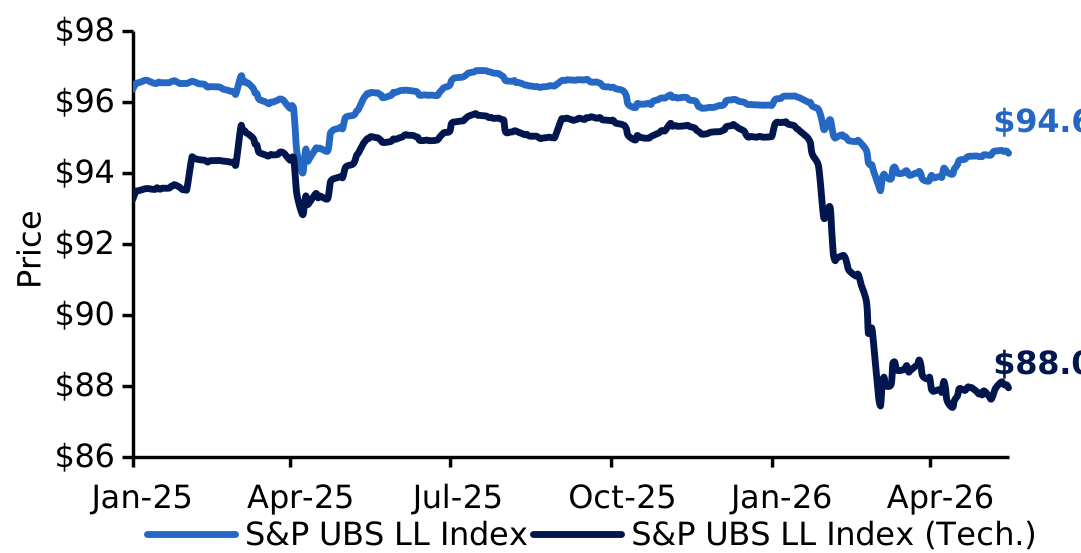
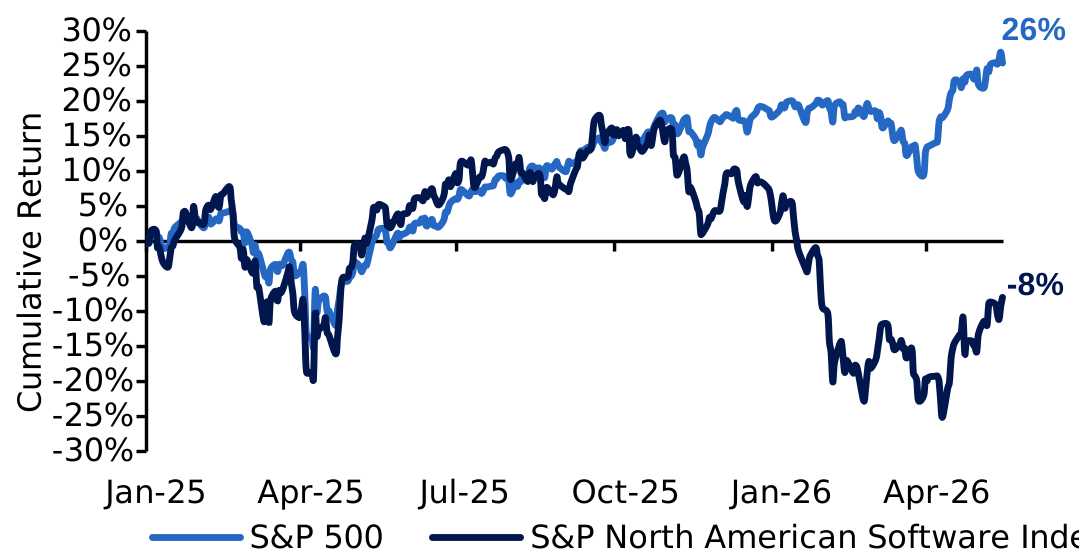
Fig. 3: Software Stocks5
3. What is the Impact of the Iran War?
Oil Shock, Rate Reset
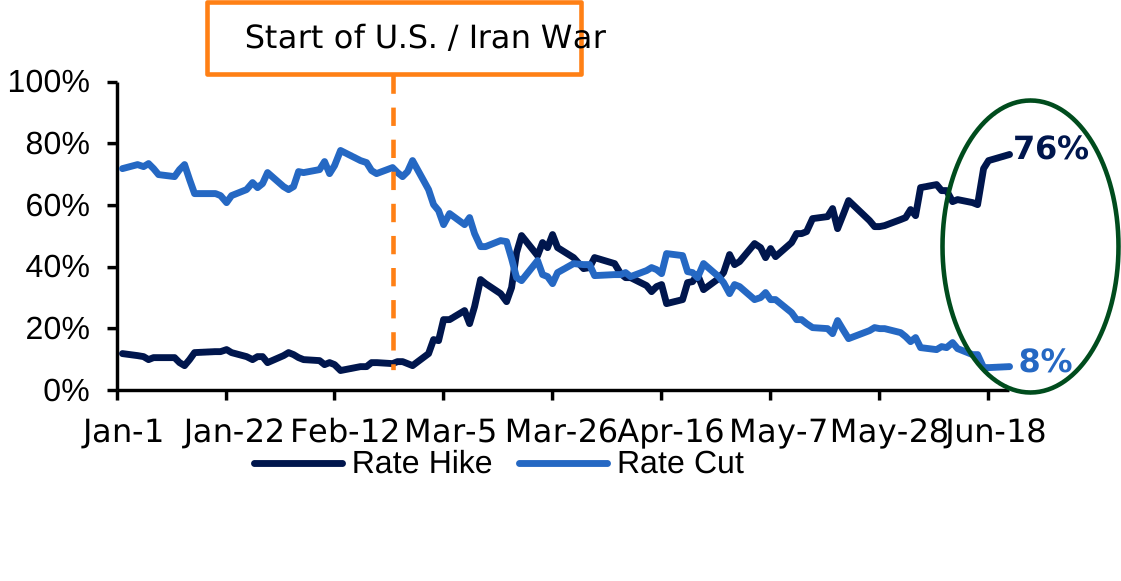
The conflict between the United States and Iran has shifted the interest rate outlook. While oil prices have pulled back from their recent highs to $77 per barrel (Figure 4) amid signs of potential de-escalation, government bond yields remain elevated, with the U.S. 10-year at 4.5%. As higher energy costs feed through to inflation, market expectations for monetary policy have adjusted, with the implied probability of a rate increase rising to 76% versus 8% for a cut (Figure 5). Equity markets have remained resilient, with the Nasdaq up 12.9% and the S&P 500 up 9.8% year to date. However, if energy prices remain elevated, secondary effects such as higher input costs, pressure on consumer spending, and a reduced likelihood of near-term rate cuts are likely to stay pronounced.
Credit impacts of the recent energy disruption have been largely contained to date, consistent with prior sector dislocations OHA has navigated, including energy and telecom. Unlike historical stress periods (1991, 2001–2003, or 2008–2009), forced selling remains limited and corporate balance sheets are broadly stable.
Where pressure is developing from higher-for-longer rates, particularly in overleveraged 2018–2021 vintage capital structures OHA sees a path to favorable outcomes in many cases. The firm has used recent volatility to selectively add to high-conviction positions at discounted levels, while maintaining a strong focus on downside protection.
Fig. 4: Oil Price8
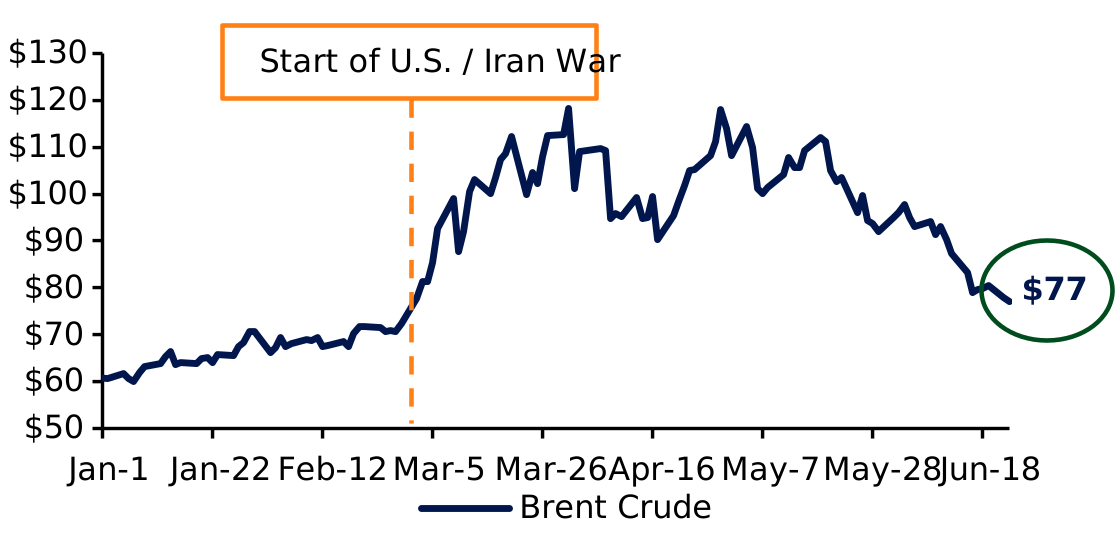
Fig. 5: Probability of Fed Actions9
4. Is there Systemic Risk in Private Credit?
The “Assault” on BDCs & Private Credit
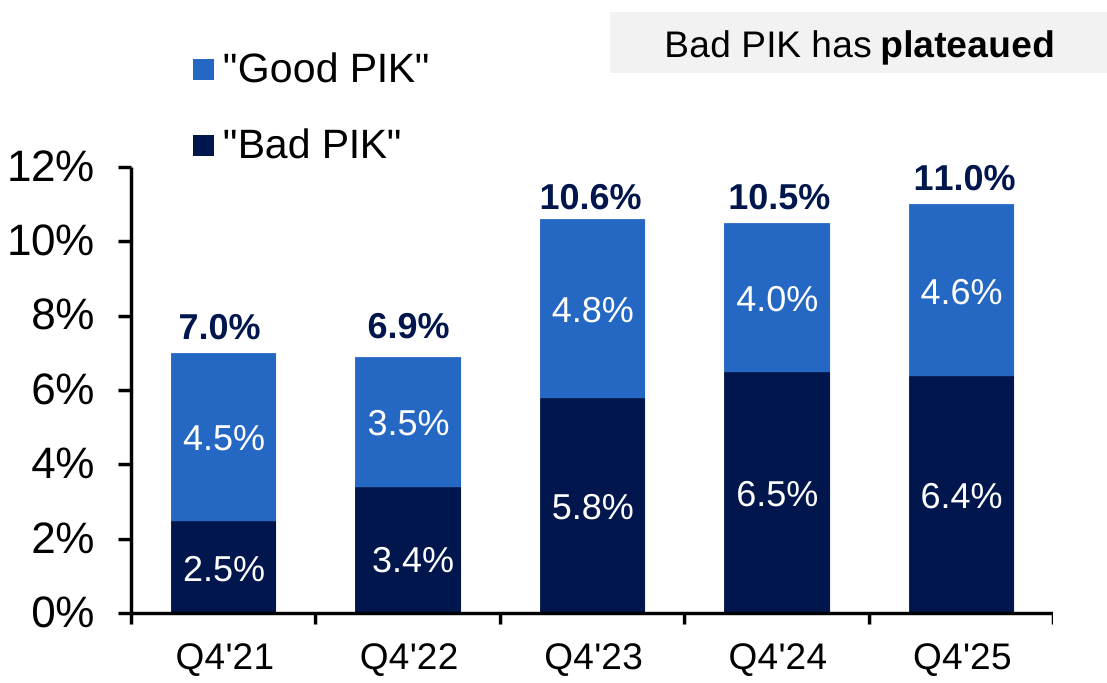
The public business development company (“BDC”) market has experienced a notable selloff since mid-July 2025, returning –17% versus +26% for the Russell 2000.13 This volatility reflects recent investor concerns around potential broad-based deterioration in private credit, largely driven by the “cockroaches” narrative and AI disruption fears. However, BDC portfolios generally do not show broad-based credit deterioration in recent quarters, suggesting price volatility has been driven more by sentiment than fundamentals. Non-accrual rates and PIK by amendment, commonly referred to as “Bad PIK”, have remained stable, alongside leverage and interest coverage ratios, as seen in Figure 7.14 Importantly, dispersion across managers remains significant, reinforcing the importance of disciplined underwriting, rigorous credit standards, and thoughtful manager selection in a more volatile environment.
Recent outflows from non-traded BDCs, which offer partial liquidity, reflect weaker investor sentiment that OHA believes is largely concentrated in individual investors. This development has also raised questions about the structural stability of the private credit asset class, but non-traded BDCs represent only a small portion of the $1.5 trillion private credit market, as shown in Figure 6. Approximately 80% of these assets are held in closed-end vehicles with largely institutional investors and permanent capital structures, limiting liquidation risk. At the same time, reduced BDC inflows have eased competition and contributed to more lender-friendly pricing and terms for well-positioned private lenders like OHA.
Fig. 6: Direct Lending Market Composition11
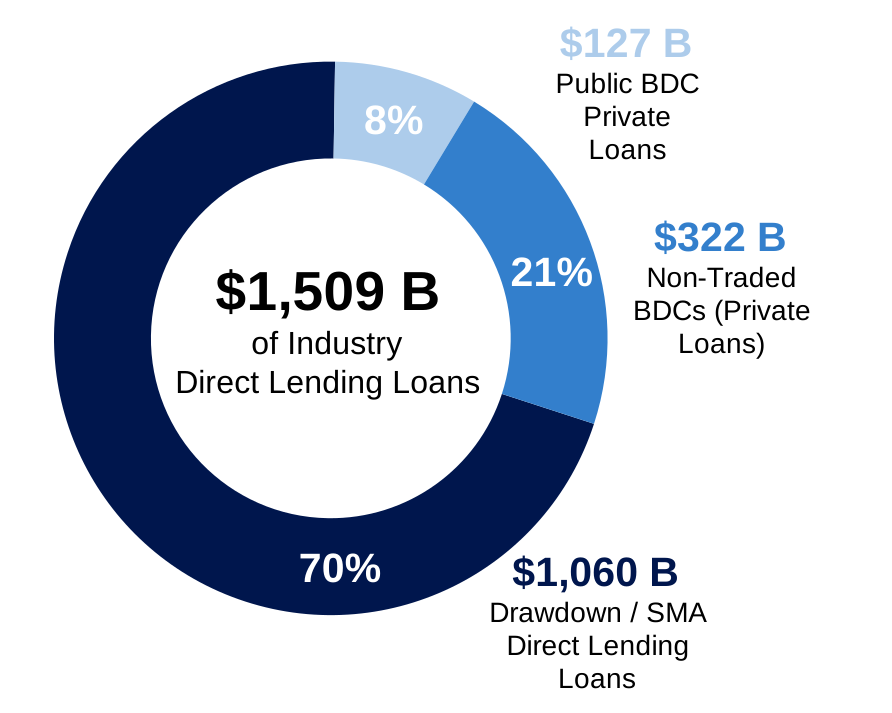
Fig. 7: PIK Loans % of All Loans12
5. Is there a Dislocation Opportunity?
Expanded Opportunity Set
OHA believes the current environment presents a genuine dislocation opportunity, as elevated volatility and dispersion are creating more attractive entry points for investors able to differentiate between potential winners and losers across credit markets.
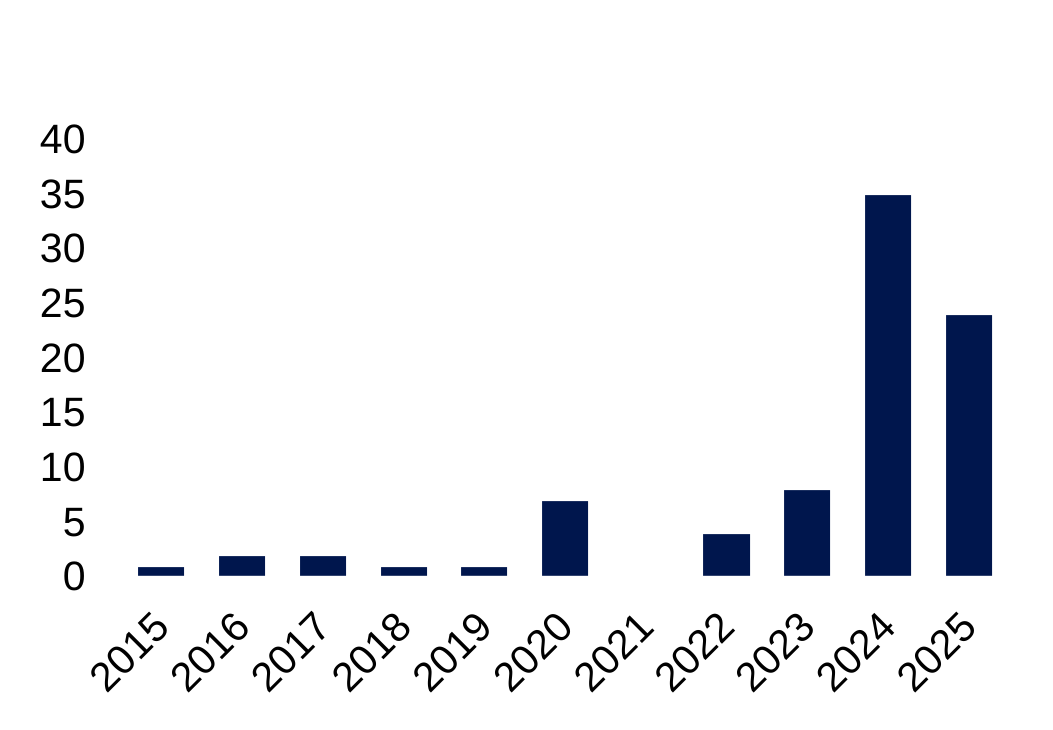
We believe the following dynamics point toward an attractive potential dislocation opportunity. First, a significant private credit maturity wall is approaching, as shown in Figure 8, rising to $123 billion in 2028 and remaining elevated through 2030. These maturities are particularly pronounced in software which represents approximately 23% of private credit.17 Should financing constraints in the sector persist, upcoming maturities can create a wide range of capital solutions and restructuring opportunities for experienced managers. Second, the recent rise in liability management exercises (“LMEs”) shown in Figure 9 reflects a “new normal” to address pressures on existing capital structures in the higher-for-longer rate environment. As borrowers pursue restructurings, maturity extensions, and other out-of-court solutions, the demand for flexible, opportunistic capital grows.
OHA believes managers with the requisite capabilities can be constructive partners for companies navigating these situations and capture attractive, well-protected economics. Distinguishing genuine stress from manageable complexity is critical, and OHA’s underwriting discipline enables it to identify mispriced risk where others see uncertainty. Today’s environment should favor investors with the discipline and flexibility to capitalize on dislocation and dispersion.
Fig. 8: Private Credit Maturity Wall $ / Market Share15
First Lien, Unitranche & Second Lien
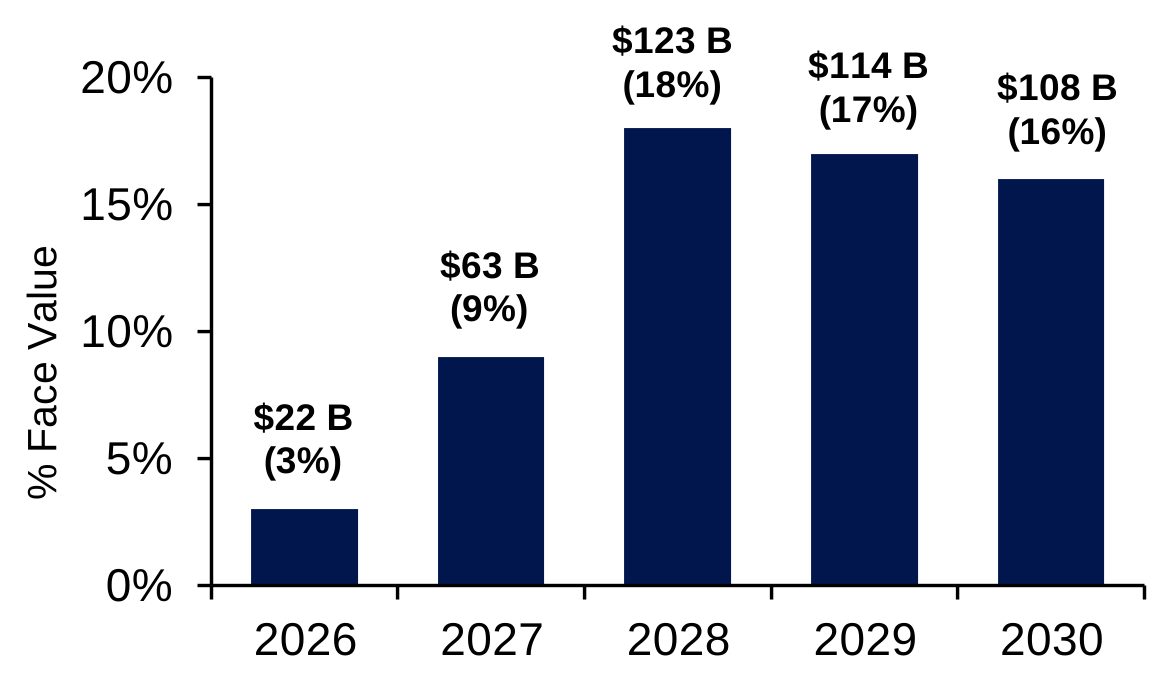
Fig. 9: LMEs Have Increased in Frequency16

- Fall 2024
- Video
The 'Magnificent Seven' lender protections
Learn more about the key lender protections that OHA negotiates in its credit agreements to enhance protections for investors.

- Summer 2024
- Video
Industry spotlight: Software credit
Read more to learn why OHA believes software companies can offer attractive all-weather investment profiles and inherent diversification as an “industry of industries”.
Appendix and Endnotes
1 As of April 30, 2026. Sources: Preqin Global Private Debt, BofA Global Research, S&P UBS. Average Issuer Size represents face value. Private credit AUM as of September 30, 2025.
2 JPMorgan Research. U.S. high yield and leveraged loan default rates since 1987 for high yield and 1998 for leveraged loans, calculated by par on an LTM basis. Default rates include distressed exchanges.
3 BofA Global Research, ICE Data Indices LLC, LCD/Pitchbook.
4 Past performance is not indicative of future results. As of May 15, 2026. Represents the par-weighted price of the S&P UBS Leveraged Loan Index and the Information Technology industry subset of the S&P UBS Leveraged Loan Index.
5 Past performance is not indicative of future results. As of May 15, 2026. Represents the S&P North American Expanded Technology Software Index (USD) and the S&P 500 Index. Data is normalized beginning December 31, 2024.
6 Past performance does not guarantee future results. As of December 31, 2025. Based on Total Capital Invested for firmwide investments in software companies from 2004 – 2025 including private and syndicated investments.
7 Source: McKinsey as of April 28, 2025. (2) Source: McKinsey Data Center Demand Model; Gartner reports; IDC reports; Nvidia capital markets report as of April 28, 2025.
8 Past performance is not indicative of future results. As of June 22, 2026. Source: Bloomberg.
9 Past performance is not indicative of future results. As of June 22, 2026. Federal Reserve Bank of Atlanta.
10 Past performance is not indicative of future results. As of June 22, 2026. Source: Bloomberg.
11 As of December 31, 2025. Source: Preqin, LSEG Data & Analytics, Goldman Sachs Investment Research.
12 As of December 31, 2025. Source: Lincoln International VOG Proprietary Market Database. Lincoln’s data reflects ~6,000 portfolio valuations per quarter. © 2023 Lincoln Partners Advisors LLC. All rights reserved. Third party use is at user’s own risk. Equal weighted and includes first lien / unitranche loans of US companies only. Bad PIK is defined as instances where a security was paying only cash interest at close, even if a PIK toggle was present, but has implemented any level of PIK as of the current valuation period.
13 Publicly traded BDCs represents the Cliffwater BDC Index (CWBDC), which is a capitalization-weighted index that measures the performance of lending-oriented, exchange-traded Business Development Companies (BDCs), subject to certain eligibility criteria regarding portfolio composition, market capitalization, and dividend history. The CWBDC Total Return Index includes two components: 1) Income Return and 2) Price Return. Source: Bloomberg as of May 15, 2026.
14 LBO leverage multiples from PitchBook LCD Leveraged Buyout Debt Report as of December 31, 2025. Includes U.S. LBOs. Prior to 2003, Media, Telecom, Energy and Utility Deals, are excluded. All outliers, regardless of the industry, are excluded. Interest coverage ratios from LSEG Data and Analytics, BDC Collateral as of June 30, 2025. Includes public and private BDCs.
15 Private credit maturity wall sourced from KBRA DLD as of March 31, 2026. Dataset inclusive of unitranche, first lien and second lien loans and is comprised of $688 B through 2033.
16 Source: Paul Hastings analysis as of December 31, 2025.
17 Private Credit Market represents the Cliffwater Direct Lending Index as of September 30, 2025 and shows the % of direct lending deals.
Key risks and disclosures
This document is for informational purposes only and does not constitute an offer to sell or a solicitation of an offer to buy any securities or partnership interests. Any investor who subscribes, or proposes to subscribe, for an investment in a fund or separately managed account must be able to bear the risks involved and must meet relevant suitability requirements. Fixed-income securities are subject to credit risk, liquidity risk, call risk, and interest-rate risk. As interest rates rise, bond prices generally fall. Investments in high-yield bonds involve greater risk of price volatility, illiquidity, and default than higher-rated debt securities. International investments can be riskier than U.S. investments due to the adverse effects of currency exchange rates, differences in market structure and liquidity, as well as specific country, regional, and economic developments. Some or all alternative investments may not be suitable for certain investors. No assurance can be given that a fund or separately managed account’s investment objectives will be achieved. Alternative investments are speculative and involve a substantial degree of risk. Opportunities for withdrawal/redemption and transferability of interests are generally restricted, so investors may not have access to capital when it is needed. The use of leverage will magnify the potential for loss on amounts invested. The use of a single advisor applying generally similar trading programs could mean lack of diversification and, consequently, higher risk. The use of leverage and other speculative practices may increase the risk of investment loss or make investment performance volatile. In addition, the fees and expenses charged may be higher than the fees and expenses of other investment alternatives, which will reduce profits. There can be no assurance that an advisor will be able to implement its strategy or avoid incurring any losses. Diversification cannot assure a profit or protect against loss in a declining market.Opinions and estimates offered herein constitute the judgment of OHA as of the date this document is provided to you (unless otherwise noted) and are subject to change, as are statements about market trends. All opinions and estimates are based on assumptions, all of which are difficult to predict and many of which are beyond the control of OHA in addition, any calculations used to generate the estimates were not prepared with a view towards public disclosure or compliance with any published guidelines. In preparing this document, OHA has relied upon and assumed, without independent verification, the accuracy and completeness of all information. OHA believes that the information provided herein is reliable; however, it does not warrant its accuracy or completeness.This document may contain, or may be deemed to contain, forward-looking statements, which are statements other than statements of historical facts. By their nature, forward-looking statements involve risks and uncertainties because they relate to events and depend on circumstances that may or may not occur in the future. The future of investment results of the investments described herein may vary from the results expressed in, or implied by, any forward-looking statements included in this document, possibly to a material degree.The recipient may contact OHA at (212) 326-1500 to obtain additional information or ask questions about any information, including the methodology used for any calculations and details concerning any of the summary charts or information provided herein.
© 2026 Oak Hill Advisors. All Rights Reserved. OHA is a trademark of Oak Hill Advisors, L.P. All other trademarks shown are the property of their respective owners. Use does not imply endorsement, sponsorship, or affiliation of Oak Hill Advisors with any of the trademark owners.
Important Information
This material is provided for informational purposes only and is not intended to be investment advice or a recommendation to take any particular investment action.The views contained herein are those of the authors as of June 2025 and are subject to change without notice; these views may differ from those of other T.RowePrice associates.This information is not intended to reflect a current or past recommendation concerning investments, investment strategies, or account types, advice of any kind, or a solicitation of an offer to buy or sell any securities or investment services. The opinions and commentary provided do not take into account the investment objectives or financial situation of any particular investor or class of investor. Please consider your own circumstances before making an investment decision.Past performance is no guarantee or a reliable indicator of future results. All investments are subject to market risk, including the possible loss of principal. All charts and tables are shown for illustrative purposes only.T.Rowe Price Investment Services, Inc. OHA is a T. Rowe Price company.
© 2026 T. Rowe Price. All Rights Reserved.
202607-5722053