
After Sell-off, Are Public BDCs More Attractive than Non-Traded BDCs?
December 2025
Key Takeaways
- Following the significant recent sell-off in publicly traded business development companies (“BDCs”), investors are asking if they are more attractive than non-traded BDCs.
- OHA believes public BDC shares may selectively offer a tactical trading opportunity while non-traded BDCs offer a long-term investment in private credit.
- OHA believes non-traded BDCs continue to offer several advantages including lower volatility, consistent income-driven returns, higher quality portfolios and lower fees.
Market Snapshot: Public BDC Performance and Key Drivers
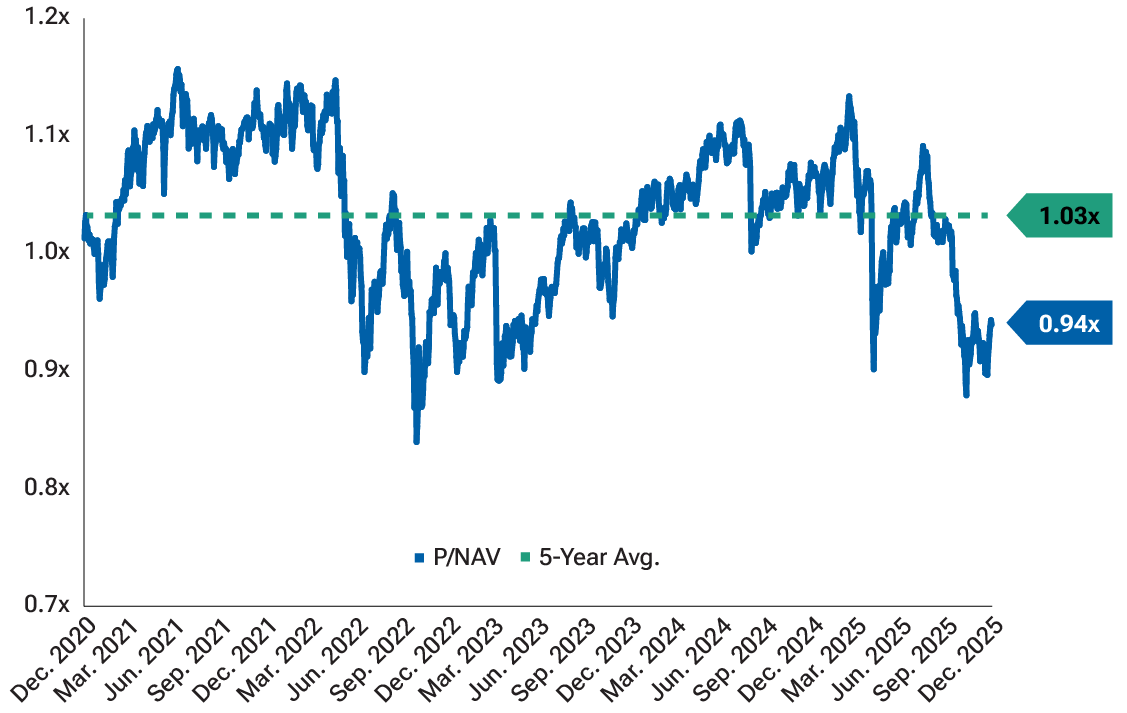
Public BDCs declined –8% since mid-July (vs. +12% for Russell 2000) to average 0.94x Price / Net Asset Value (“NAV”), below1.03x 5-year average(1).
OHA’s investment team has deep experience in public BDCs.Having researched the recent sell-off, we believe it is driven by:
1. Investor sentiment and trading dynamics, influenced byconcerns that recent publicized individual credit losses (e.g., FirstBrands, Tricolor) reflect systemic weakness in private credit.
― OHA believes these examples are largely idiosyncratic, evidenced by overall stable fundamental trends, includingsteady cash flows and manageable debt levels.
2. Investors pricing in lower pro forma yields on public BDCs from:
― Lower base rates, Secured Overnight Financing Rate (“SOFR”) projected to normalize at ~3.0% by 2027.(3)
― Increasing exposure to tighter spreads from new originations.
― Higher public BDC financing costs, as cheaper debt matures.
Fig. 1: Public BDC Universe(2) Price / NAV
As of December 2, 2025
Investing in Discounted Public BDCs vs. Non-Traded BDCs: Key Considerations
― OHA believes public BDCs and non-traded BDCs currently offer two fairly distinct potential types of investment opportunities.
― Manager and vehicle selection are critical given growing performance dispersion across portfolios for public and non-traded BDCs.
― Attractiveness of discount to NAV for public BDCs must be assessed relative to lower pro forma yields and portfolio quality.
― The recent public BDC sell-off reinforces the key advantages of non-traded BDCs for individuals seeking access to private credit.
Are Public BDC Discounts Enough to Outshine Non-Traded BDCs?
Investors are asking if the current discount to NAV makes public BDCs more attractive than non-traded BDCs, given both provide access to private credit assets. OHA believes that:
― Select public BDCs may offer a tactical trading opportunity, driven by potential multiple expansion from current compressed levels and the ability to correctly time entry and exit.
― However, non-traded BDCs remain best suited for investors seeking long-term access to consistent income-driven returns from private credit assets without exposure to additional price volatility.
Investors should consider the four key advantages offered by non-traded BDCs which include lower volatility, yield and distribution stability, higher quality portfolios and lower fees. Below, we explore these advantages in more detail.
Non-Traded BDCs vs. Public BDCs: Relative Attractiveness(2)(4)
Lower Volatility
― Because non-traded BDC shares are priced at NAV, they are not exposed to daily market swings, negative sentiment and technical pressures (e.g., ETF flows, forced selling) in the same way as public BDCs.
― Investors in non-traded BDCs accept lower liquidity in exchange for lower price volatility.
Yield and Distribution Stability(5)
― Non-traded BDCs typically target distribution yields which are less volatile than public BDCs. Investors in non-traded BDCs experience more stable share values, better aligned with underlying portfolios, and distribution patterns.
― Non-traded BDC yields compare favorably with public BDCs over time. Sell-offs like that in 2H 2025 may also inflate public BDC yields relative to future distributions.
Higher Quality Portfolio
― Non-traded BDCs were launched principally after 2021 and are therefore typically comprised of loans from more recent vintages, with pricing and underwriting aligned to higher interest rates and current economic conditions.
― Public BDC portfolios were generally formed earlier and still include loans originated in 2018-2021, which were largely not underwritten for higher rates.
― Non-traded BDCs have also benefitted from regular investor inflows, enabling them to deploy capital across different market cycles, resulting in natural vintage diversification.(6)
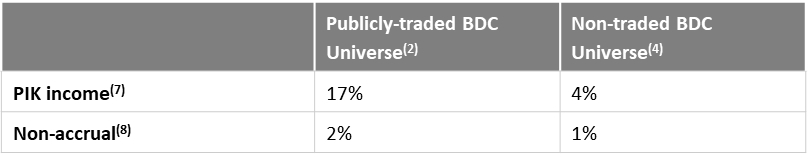
― The underlying credit quality of non-traded BDCs tends to be stronger than public BDCs, as evidenced by lower non-accrual rates and payment-in-kind (“PIK”) interest.
Fig. 2: Public BDC Universe(2) vs. Non-Traded BDC Universe(4) — Portfolio Quality Comparison
Lower Fees
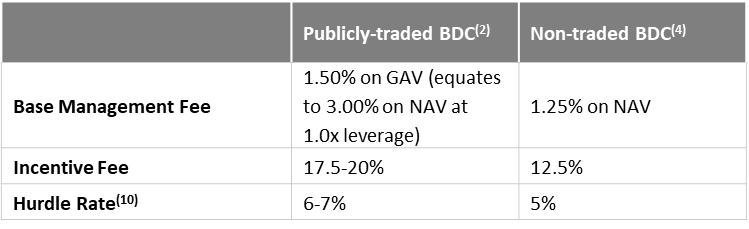
Public BDCs typically carry materially higher fee loads than non-traded BDCs, driven by both management and incentive fees.
― In general, public BDCs charge ~1.50% on gross asset value (“GAV”) vs. ~1.25% on NAV for non-traded BDCs. While headline fees differ by ~25 bps (.25%), charging on GAV amplifies the gap in effective fees paid. (2)(4)
― With one turn of leverage, investors effectively pay double the management fee on equity, or NAV.
― Incentive fees compound the difference, with public BDCs incurring an average all-in cost of ~5.1% annually vs. an average of ~3.3% for non-traded BDCs, a ~36% lower cost structure(9).
― To offset higher fees, public BDCs must trade at a material discount or generate meaningfully higher gross levered yields to deliver equivalent distribution rates.
Fig. 3: Public BDC vs. Non-Traded BDC – Typical Fee Comparison

- Summer 2024
- Video
Industry spotlight: Software credit
Read more to learn why OHA believes software companies can offer attractive all-weather investment profiles and inherent diversification as an “industry of industries”.

- Spring 2024
Credit market observations
Delve into OHA's analysis of credit markets, covering a wide range of assets including private, liquid, and structured credit.
Endnotes
1. Source: Bloomberg, as of December 2, 2025.
2. Source: Bloomberg, as of December 2, 2025. Public BDC Universe represents average of the 10 largest publicly-traded BDCs (ARCC US Equity, OBDC US Equity, BXSL US Equity, FSK US Equity, GBDC US Equity, PSEC US Equity, HTGC US Equity, GSBD US Equity, MSDL US Equity, TSLX US Equity). For illustrative purposes only.
3. Source: OHA analysis, as of October 29, 2025. The Secured Overnight Financing Rate (“SOFR”) is a broad measure of the cost of borrowing cash overnight collateralized by U.S. Treasury securities, published daily by the Federal Reserve.
4. Source: SEC filings and company websites. Non-traded BDC Universe represents average of 10 largest non-traded BDCs (T. Rowe Price OHA Select Private Credit Fund ("OCREDIT"), Blackstone Private Credit Fund ("BCRED"), Blue Owl Credit Income Corp. ("OCIC"), Apollo Debt Solutions BDC, HPS Corporate Lending Fund ("HLEND"), Oaktree Strategic Credit Fund, Ares Strategic Income Fund ("ASIF"), Nuveen Churchill Private Capital Income Fund, AG Twinbrook Capital Income Fund ("TCAP"), North Haven BDC). For illustrative purposes only.
5. Distributions are not guaranteed.
6. Source: Cliffwater, as of May 27, 2025.
7. Source: SEC filings and company websites. Figures as of latest available data: Publicly-traded BDC Universe PIK income figures as of June 30, 2025. Non-traded BDC Universe PIK income figures as of September 30, 2025.
8. Source: SEC filings and company websites. Figures as of latest available data: Publicly-traded BDC Universe non-accrual figures as of June 30, 2025. Non-traded BDC Universe non-accrual figures as of September 30, 2025, except for Oaktree Strategic Credit Fund, which is as of June 30, 2025, given reporting timeline. Non-accrual status means a loan or debt security has stopped accruing interest because there is doubt about the collection of principal or interest.
9. Source: Cliffwater, as of May 27, 2025. Inclusive of management, incentive, and administration fees.
10. A hurdle rate is the minimum required return on an investment or project to be deemed acceptable, typically adjusted for risk.
Publicly traded Business Development Companies (“BDCs”) are a type of closed-end investment fund that invests primarily in small and medium-sized private companies. Their shares are listed on national securities exchanges, allowing investors to buy and sell them like stocks. BDCs are regulated under the Investment Company Act of 1940 and must meet certain requirements, including investing at least 70% of assets in eligible portfolio companies.
Non-publicly traded BDCs are also closed-end investment funds regulated under the Investment Company Act of 1940, but their shares are not listed on national securities exchanges. Instead, investors purchase shares through continuous offerings, often at net asset value, and these funds typically offer limited liquidity through periodic share repurchase programs.
Key risks and disclosures
This document is for informational purposes only and does not constitute an offer to sell or a solicitation of an offer to buy any securities or partnership interests. Any investor who subscribes, or proposes to subscribe, for an investment in a fund or separately managed account must be able to bear the risks involved and must meet relevant suitability requirements. Fixed-income securities are subject to credit risk, liquidity risk, call risk, and interest-rate risk.
As interest rates rise, bond prices generally fall. Investments in high-yield bonds involve greater risk of price volatility, illiquidity, and default than higher-rated debt securities. International investments can be riskier than U.S. investments due to the adverse effects of currency exchange rates, differences in market structure and liquidity, as well as specific country, regional, and economic developments.
Some or all alternative investments may not be suitable for certain investors. No assurance can be given that a fund or separately managed account’s investment objectives will be achieved. Alternative investments are speculative and involve a substantial degree of risk. Opportunities for withdrawal/redemption and transferability of interests are generally restricted, so investors may not have access to capital when it is needed.
The use of leverage will magnify the potential for loss on amounts invested. The use of a single advisor applying generally similar trading programs could mean lack of diversification and, consequently, higher risk. The use of leverage and other speculative practices may increase the risk of investment loss or make investment performance volatile. In addition, the fees and expenses charged may be higher than the fees and expenses of other investment alternatives, which will reduce profits.
There can be no assurance that an advisor will be able to implement its strategy or avoid incurring any losses. Diversification cannot assure a profit or protect against loss in a declining market. Opinions and estimates offered herein constitute the judgment of OHA as of the date this document is provided to you (unless otherwise noted) and are subject to change, as are statements about market trends.
All opinions and estimates are based on assumptions, all of which are difficult to predict and many of which are beyond the control of OHA in addition, any calculations used to generate the estimates were not prepared with a view towards public disclosure or compliance with any published guidelines. In preparing this document, OHA has relied upon and assumed, without independent verification, the accuracy and completeness of all information.
This document may contain, or may be deemed to contain, forward-looking statements, which are statements other than statements of historical facts. By their nature, forward-looking statements involve risks and uncertainties because they relate to events and depend on circumstances that may or may not occur in the future.
The future of investment results of the investments described herein may vary from the results expressed in, or implied by, any forward-looking statements included in this document, possibly to a material degree. The recipient may contact OHA at (212) 326-1500 to obtain additional information or ask questions about any information, including the methodology used for any calculations and details concerning any of the summary charts or information provided herein.
Important Information
The opinions and commentary provided do not take into account the investment objectives or financial situation of any particular investor or class of investor. Please consider your own circumstances before making an investment decision. All investments are subject to market risk, including the possible loss of principal. All charts and tables are shown for illustrative purposes only.
T.Rowe Price Investment Services, Inc. OHA is a T. Rowe Price company.© 2025 Oak Hill Advisors. © 2025 T. Rowe Price. All Rights Reserved. T. ROWE PRICE, INVEST WITH CONFIDENCE, the Bighorn Sheep design and related indicators (see troweprice.com/ip) are trademarks of T. Rowe Price Group, Inc.All Rights Reserved. OHA is a trademark of Oak Hill Advisors, L.P. All other trademarks shown are the property of their respective owners. Use does not imply endorsement, sponsorship, or affiliation of Oak Hill Advisors with any of the trademark owners.
202512-5052856